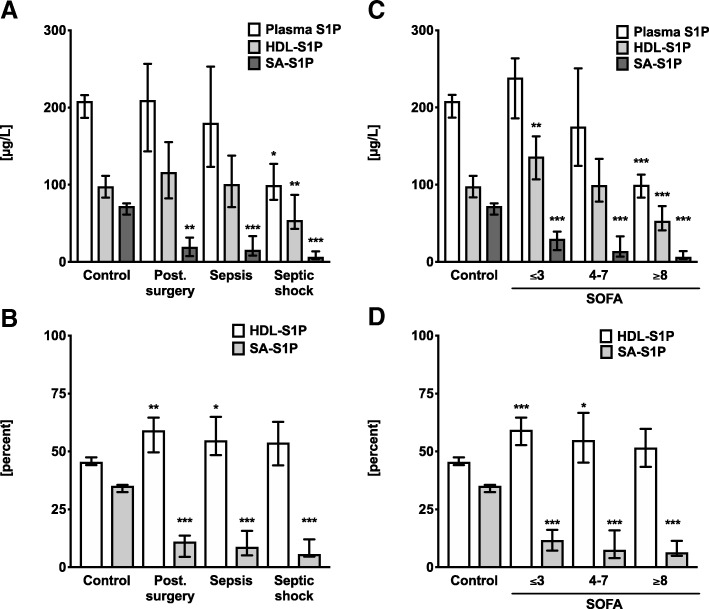
Fig. 2.
Total plasma sphingosine 1-phosphate (S1P) plotted together with S1P associated with serum albumin (SA-S1P) and S1P bound to high-density lipoprotein (HDL-S1P). a S1P in patient groups in micrograms per liter and b in fractions of total plasma S1P (percent). c, d To demonstrate levels and fractions related to severity of sepsis, the cohort was adjusted according to individual SOFA scores. Groups are compared regarding to SOFA tertiles, which are generated from 100 ICU patients: Lower SOFA ≤ 3, median SOFA 4–7, and upper SOFA ≥ 8 tertile. Groups are compared using S1P concentrations in micrograms per liter (c) and in fractions of total plasma S1P (d). Data are presented as median and 95% confidence interval. Groups are compared using a non-parametric Mann-Whitney U test against control: *P < 0.05; **P < 0.01; ***P < 0.001

