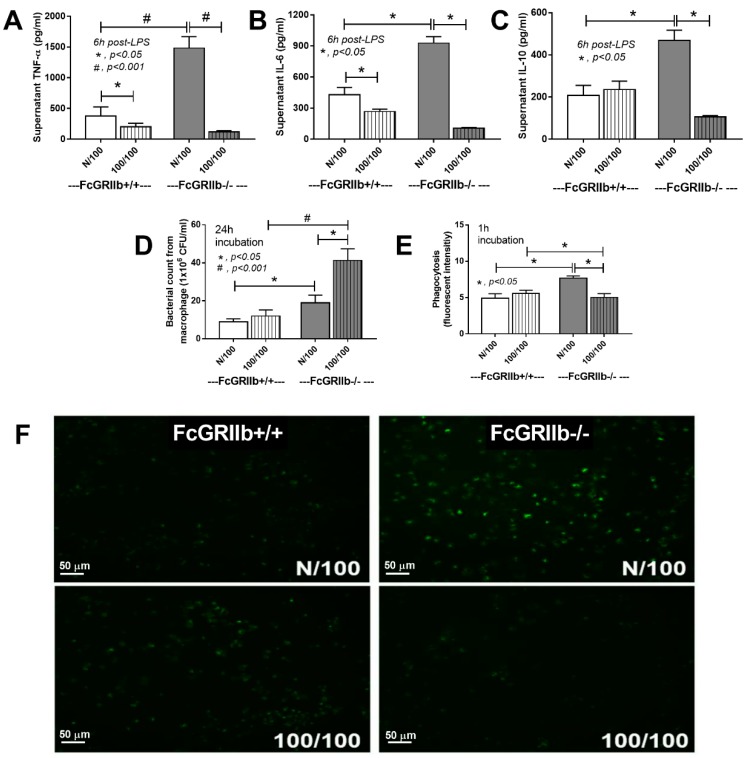
Figure 1.
The characteristics of FcGRIIb+/+ (WT) versus FcGRIIb−/− macrophages (KO) after a single LPS stimulation (N/100) and sequential LPS activation (100/100; LPS tolerance) shown as cytokine activation (A–C), microbicidal activity (D), and phagocytosis with mean fluorescent intensity (E) and the representative of phagocytosis by a fluorescent microscope (green dots were phagocytosed FITC-dextran conjugated zymosan) (F). Independent experiments were performed in triplicate.

