Figure 2.
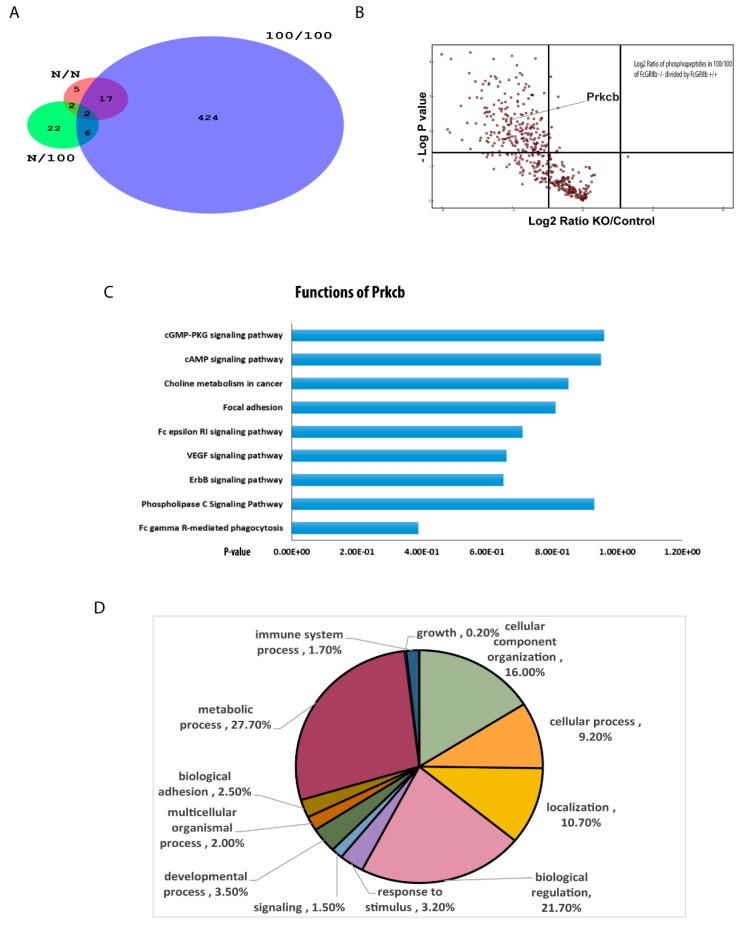
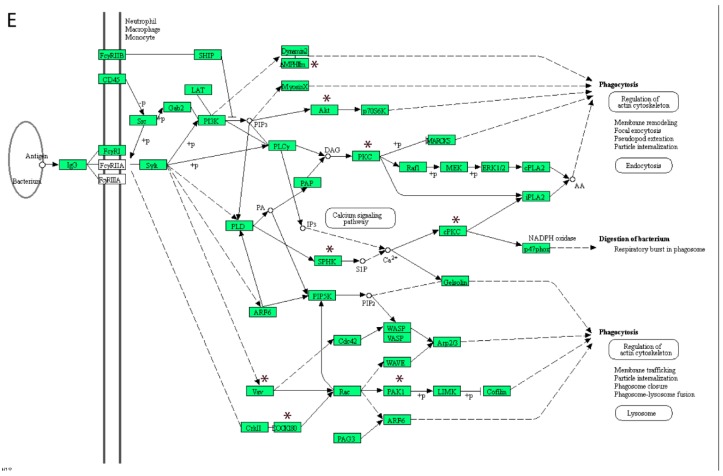
(A) Venn diagram demonstrating the different number of phosphoproteins from FcGRIIb+/+ macrophages in comparison with FcGRIIb−/− after a single LPS stimulation (N/100), sequential LPS activation (100/100; LPS-tolerance), and the control (N/N) (n = 4/each group); (B) the volcano plot analysis of downregulated phosphoproteins from the sequential LPS activation of FcGRIIb−/− compared with FcGRIIb+/+ macrophages; (C) pathway analysis clusters (DAVID) of the significantly altered phosphopeptides in FcGRIIb+/+ compared with FcGRIIb−/− in LPS-tolerance (100/100); (D) GO annotation of differentially expressed proteins (FcGRIIb+/+ compared with FcGRIIb−/−) in biological processes; and (E) the enrich pathway of the phosphoproteome of FcGRIIb+/+ compared with FcGRIIb−/− was related to the phagocytosis pathway that MPHIm, Akt, PKC, SPHK, PAK1, Vav, and DOCK180 (in black star) were the proteins involved in this pathway.


