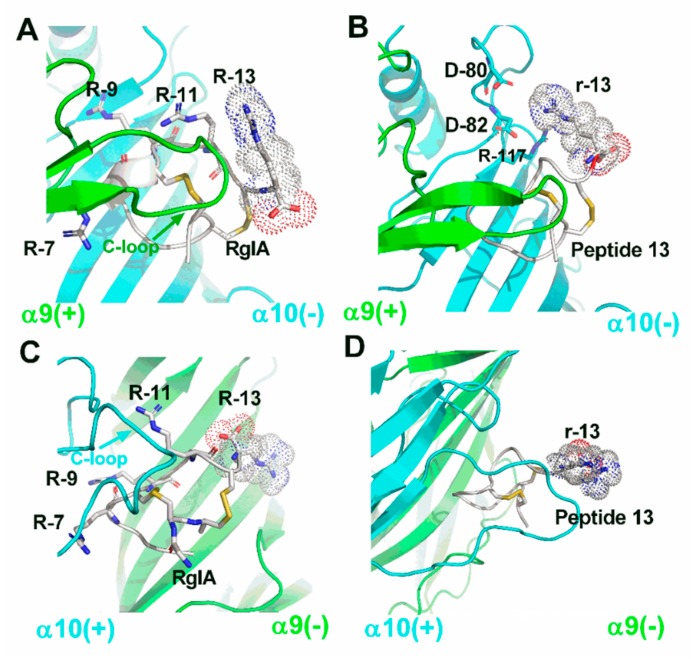
Figure 7.
Molecular models of the interactions between wildtype RgIA, peptide 13, and rat α9α10 nAChR. The α9 subunit is drawn in green, the α10 subunit is in cyan, and the peptides are in white. (A) RgIA bound with the rat α9(+)α10(–) interface, where all arginine residues in RgIA are labeled. (B) The molecular model is shown between peptide 13 and α9(+)α10(–) interface, and amino acids around 4 Å radius of the r-13 are labeled. (C) RgIA bound with rat α10(+)α9(–) interface, where all arginine residues in RgIA are labeled. (D) The molecular model is shown between peptide 13 and α10(+)α9(–) interface. All images were produced by PyMOL.

