
Table 2.
Selected NMR signals of the milk lipid fraction and their relaxation times, Τ1, which were used for the quantification of analytes in milk samples.
| Protons | Chemical Shift [δ (ppm)] | Relaxation Time T1 (s) |
|---|---|---|
| CH(12)=CH(11)—CH(10)=CH(9) a | 6.28 | 1.5 |
|
5.80 (H-9) | 3.2 |
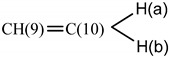
| 4.99 (H-10) b | 3.2 | |
| CH=CH–CH2–CH=CH c | 2.81 | 1.5 |
| CH=CH–CH2–CH=CH d | 2.77 | 1.5 |
| C(2)H2COOR | 2.33 | 2.0 |
| CH2–CH=CH– | 2.02 | 2.0 |
| CH3 e | 0.95 | 1.7 |
| CH3 f | 0.88 | 1.7 |
a CH(11) of (9-cis, 11-trans) 18:2 CLA. b H(10a) of caproleic acid. c bis-allylic protons of α-linolenic acid. d bis-allylic protons of linoleic acid. e CH3 group of butyric acid. f CH3 group of fatty acids except ω-3 and butyric acid.