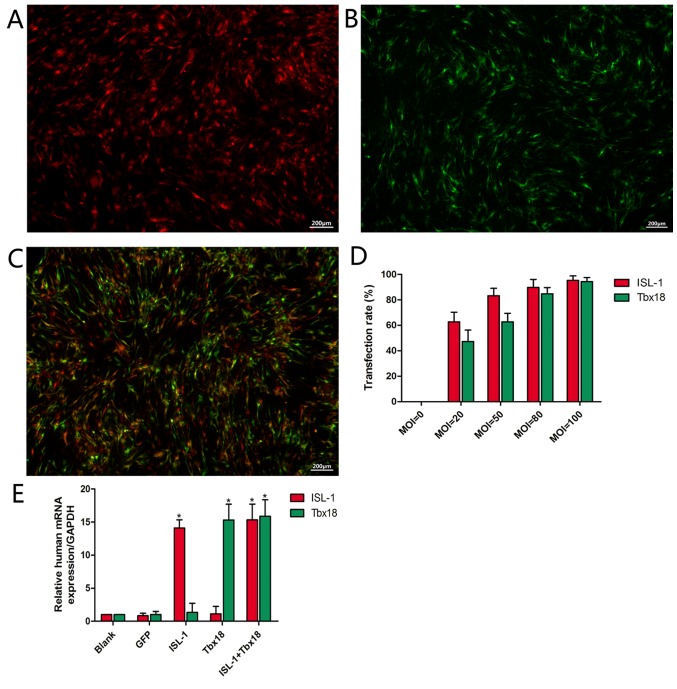
Figure 1.
Transfection rate, transfected gene expression and culture conditions. (A) ISL-1-ADSCs observed at 48 h under a fluorescence microscope (magnification, ×40). (B) Tbx18-ADSCs observed at 48 h under a fluorescence microscope (magnification, ×40). (C) ISL-1+Tbx18-ADSCs observed at 48 h under a fluorescence microscope (magnification, ×40). (D) Transfection rate of different MOI values. (E) Expression of human ISL-1mRNA and Tbx18mRNA in the transfected groups. Scale bar=200 µm. *P<0.05 vs. GFP group. Tbx18, T-box 18; ISL-1, insulin gene enhancer binding protein 1; ADSCs, adipose tissue-derived stem cells; MOI, multiplicity of infection; GFP, green fluorescent protein.

