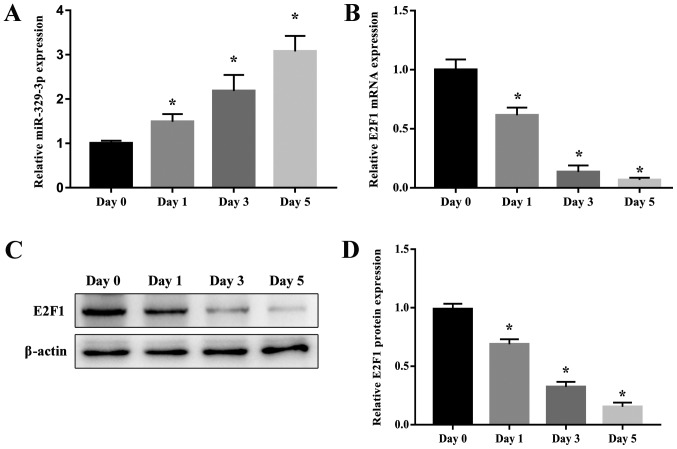
Figure 3.
Expression of miR-329-3p and E2F1 during NSC differentiation. (A) RT-qPCR analysis of miR-329-3p on days 0, 1, 3, and 5 after induction of neuronal differentiation. (B) RT-qPCR analysis of E2F1 mRNA expression and (C) western blot analysis of E2F1 protein expression on days 0, 1, 3, and 5 after induction of neuronal differentiation. GAPDH and β-actin were probed as internal controls for (B) and (C) respectively. (D) Quantification of protein expression. U6 was measured as an internal control for miR-329-3p. Data are presented as the mean ± standard deviation. *P<0.05 vs. day 0. miR, microRNA; E2F1, transcription factor E2F1; NSC, neural stem cell; RT-qPCR, reverse transcription quantitative polymerase chain reaction.

