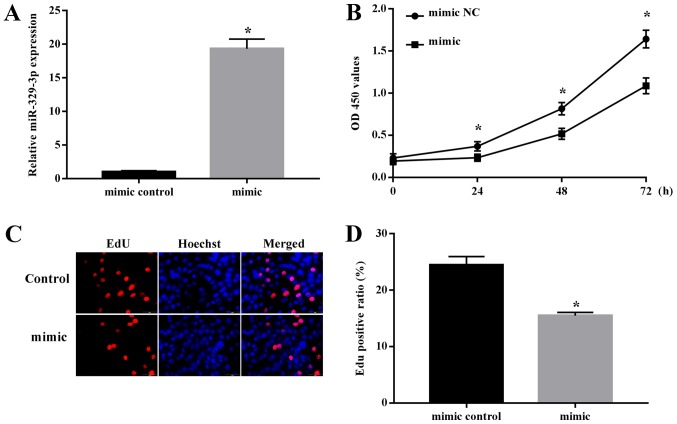
Figure 4.
Regulation of NSC proliferation by miR-329-3p. NSCs were transfected with a control mimic or miR-329-3p mimics for 48 h and then analyzed. (A) Reverse transcription quantitative polymerase chain reaction analysis of miR-329-3p expression level. (B) Cell Counting Kit-8 assay of NSC proliferation. (C) EdU assay of NSC proliferation. Red and blue staining indicates EdU and Hoechst staining, respectively. Scale bar, 50 µm. (D) Quantification of EdU-positive cells. U6 was used as an internal control for miR-329-3p. Data are presented as the mean ± standard deviation. *P<0.05 vs. negative control mimic. NSC, neural stem cell; miR, microRNA; NC, negative control; OD, optical density; EdU, 5-ethynyl-2′-deoxyuridine.

