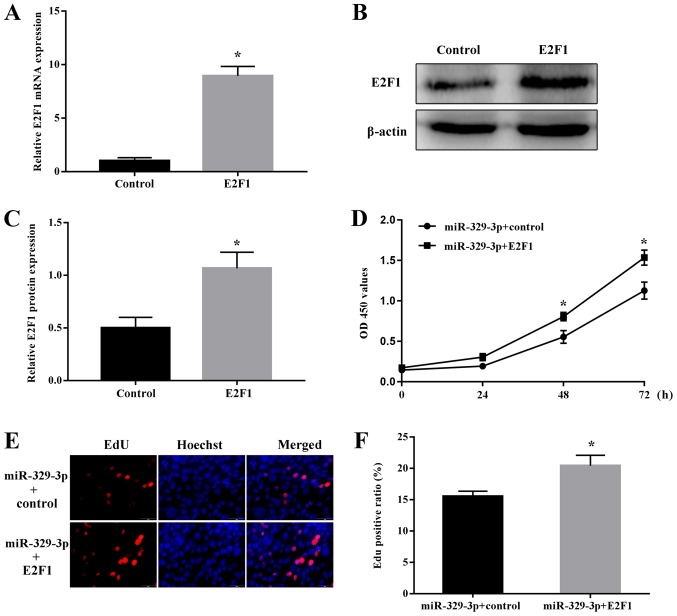
Figure 7.
miR-329-3p-mediated regulation of NSC proliferation via E2F1. (A) Reverse transcription quantitative polymerase chain reaction analysis of E2F1 mRNA expression and (B) western blot analysis of E2F1 protein expression. GAPDH and β-actin were probed as internal controls for (A) and (B) respectively. (C) Quantitative analysis of protein expression. (D) Cell Counting Kit-8 assay of NSC proliferation. (E) EdU assay of NSC proliferation. Red and blue indicate EdU and Hoechst nuclear staining, respectively. Scale bar, 50 µm. (F) Quantification of EdU-positive cells. Data are presented as the mean ± standard deviation. *P<0.05 vs. control. miR, microRNA; NSC, neural stem cell; E2F1, transcription factor E2F1; OD, optical density; EdU, 5-ethynyl-2′-deoxyuridine.

