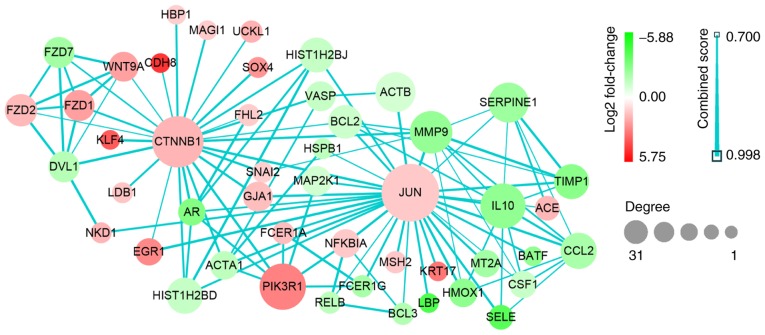
Figure 7.
Protein-protein interaction data network of JUN and CTNNB1. Red, upregulation; green, downregulation. Color depth and size of the dots were proportional to the fold change and correlated degree, respectively; thickness of the line between two nodes indicated the connection strength positively. CTNNB1, catenin β1; JUN, Jun proto-oncogene.

