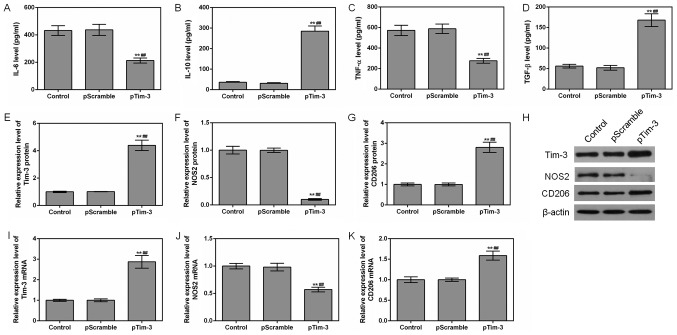
Figure 4.
Effects of Tim-3 gene overexpression on macrophages. The levels of (A) IL-6, (B) IL-10, (C) TNF-α and (D) TGF-β in the control, NC and pTim-3 groups were detected using ELISAs. (E) Tim-3, (F) NOS2 and (G) CD206 protein levels were assessed by western blot analysis. (H) Representative western blot image. (I) Tim-3, (J) NOS2 and (K) CD206 mRNA levels were analyzed by reverse transcription quantitative polymerase chain reaction assays. **P<0.01 vs. control group; ##P<0.01 vs. NC group. Data are presented as mean ± standard deviation (n=5). IL, interleukin; TNF-α, tumor necrosis factor α; TGF-β, transforming growth factor; Tim-3, T-cell Immunoglobulin-mucin-3; NOS2, nitric oxide synthase, inducible; CD206, macrophage mannose receptor 1; pTim-3, overexpressing Tim-3 plasmid.

