Fig. 10.

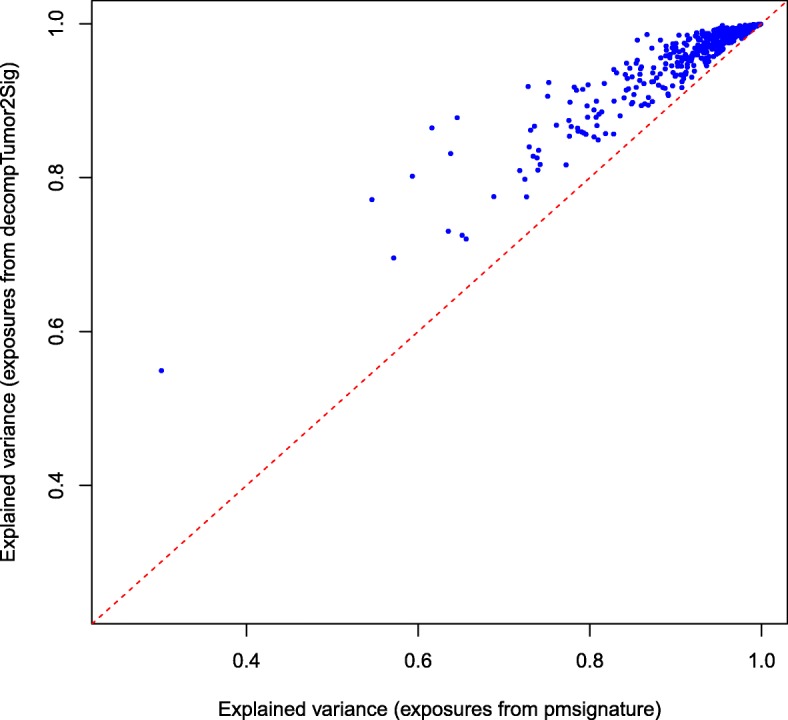
Comparison of signature refitting versus de novo inference. The figure plots for all 435 tumors the explained variance of the exposures as predicted by decompTumor2Sig and originally determined by pmsignature

Comparison of signature refitting versus de novo inference. The figure plots for all 435 tumors the explained variance of the exposures as predicted by decompTumor2Sig and originally determined by pmsignature