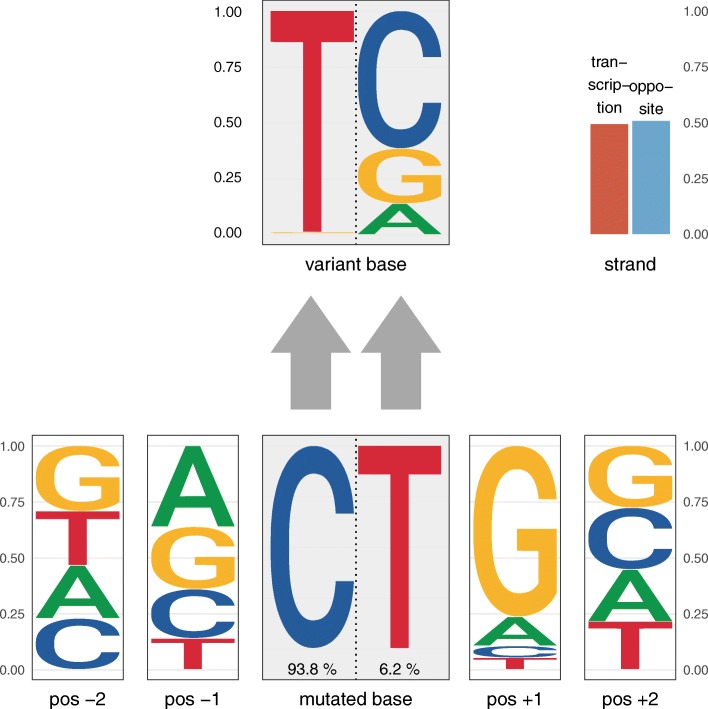
Fig. 2.
The probabilistic Shiraishi model of mutational signatures. The example signature shown here uses two flanking bases in each direction and was obtained from 435 tumor genomes. It likely represents mutations caused by spontaneous deamination of 5-methylcytosine. The corresponding mutation frequencies are shown in Table 1. In contrast to pmsignature’s graphical representation of Shiraishi-type signatures (see Figure S6 in Additional file 1), decompTumor2Sig’s representation of the mutation frequency data uses sequence logos for the flanking bases and the variant bases (with the heights of the bases being proportional to their probability/frequency). The mutated bases (C or T) are represented next to each other and their respective frequency is indicated below. This side-by-side representation of the mutated bases allows to distinguish the probabilities of variant bases (on top) according to the mutated base. Transcription strand bias (if information on transcription direction is used) is shown in the upper right corner

