Fig. 9.

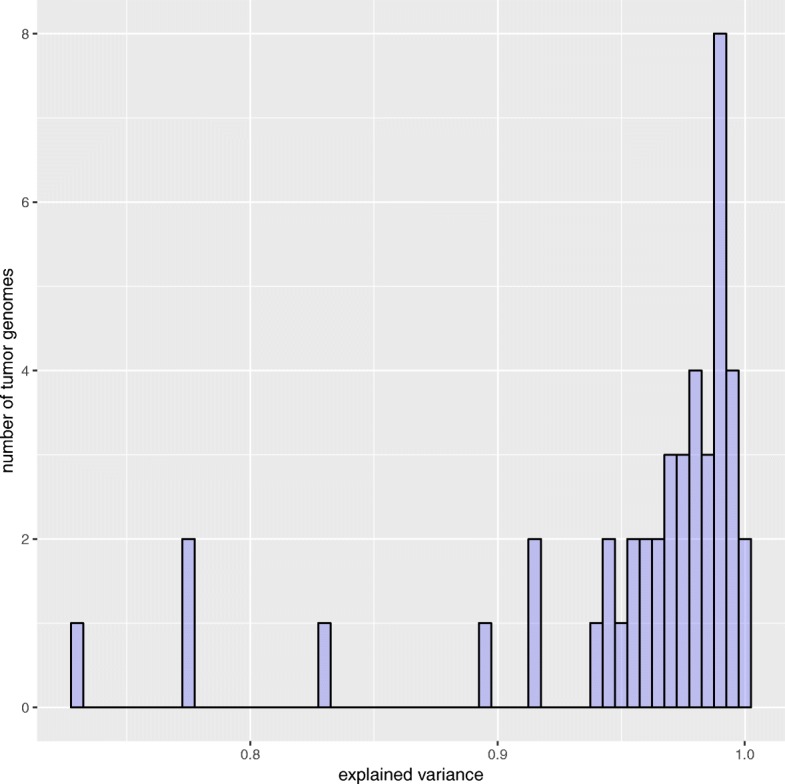
Maximum explained variance. The histogram shows the maximum variance of the mutation patterns of 44 tumor genomes that could be explained when taking all 15 signatures

Maximum explained variance. The histogram shows the maximum variance of the mutation patterns of 44 tumor genomes that could be explained when taking all 15 signatures