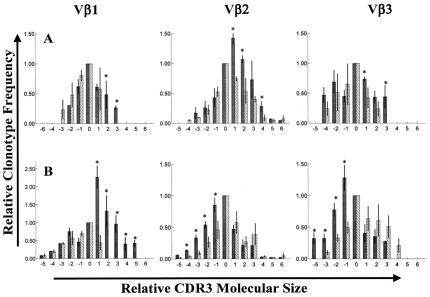
Figure 4.
(A and B) Comparison of TCR Vβ clonotype frequencies for prostate-infiltrating and circulating T cells recovered from patients treated with androgen ablative therapy. Histograms in A and B depict the relative frequency of TCR clonotypes (CDR3 products) within Vβ-chain families 1, 2, and 3 for prostate-infiltrating T cells (black bars) relative to patient-matched circulating T cells (hatched bars). Vertical axes represent mean frequencies of Vβ clonotypes (±SD) normalized against a predominant clonotype within each Vβ family for circulating T cells (arbitrarily assigned an x value of 0.0 and y value of 1.0). Horizontal axes represent relative molecular size of CDR3 products within each Vβ family. Data are mean values generated from triplicate assays repeated on three separate occasions. For all histograms, * denotes prostate T cell clonotypes that are significantly increased (P < 0.05) relative to corresponding circulating T cell clonotypes. A demonstrates significant skewing of Vβ spectratypes, relative to circulating T cell spectratypes, for T cells within a single prostate specimen from a representative androgen-ablated subject. B represents averaged Vβ spectratypes for T cells recovered from four widely separated locations (central, anterior, and left and right posterior) within the prostatectomy specimen of a second androgen ablated subject. Fairly concordant patterns of spectratype skewing throughout the prostate are evidenced by the relatively small variation (SD) in individual clonotype frequencies. Similarly, concordant patterns of prostate T cell spectratype skewing for Vβs 1, 2, and/or 3 have also been observed throughout the prostate tissues of 5/5 additional androgen ablated subjects analyzed to date.

