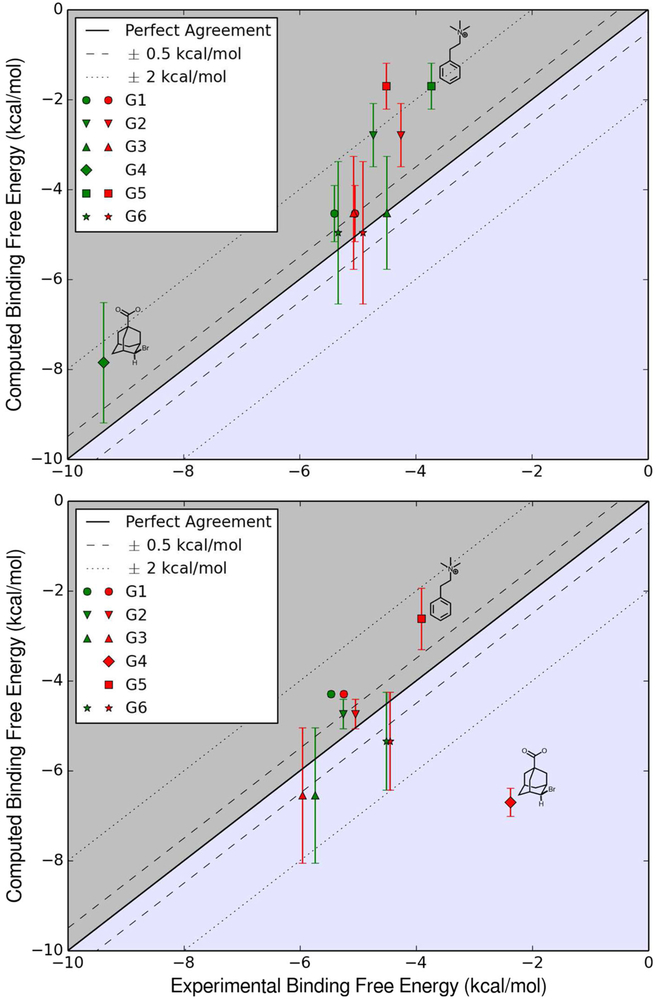
Fig. 5.
Top Computed for OAH and guests versus ITC and NMR values. Bottom Computed for OAMe and guests versus ITC and NMR values. Values from the ITC data set are represented by green symbols and from the NMR data set are represented in red. Above the ’perfect agreement’ line, the values are underestimated, and below the line values are overestimated

