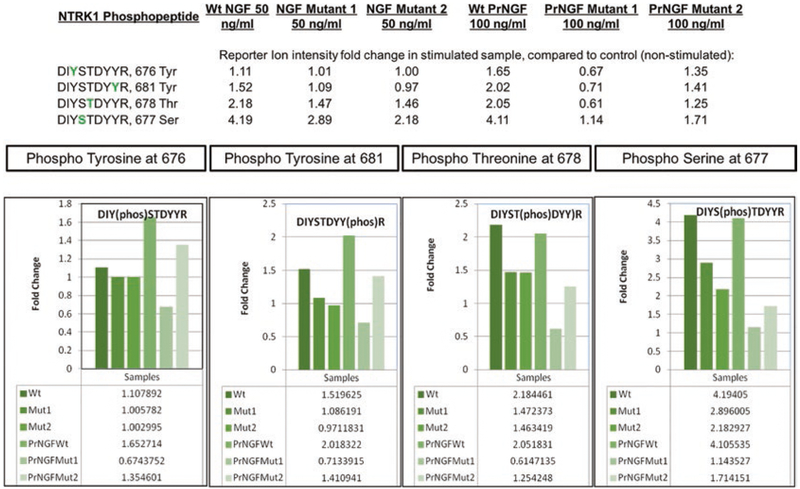
Fig. 4.
Phosphopeptide quantitation. Relative quantitation of four phosphopeptides in the high-affinity nerve growth factor receptor (NTRK1) that are stimulated by two different doses (50 and 100 ng/mL) of wild type and mutant NGF or proNGF (PrNGF) ligand, compared to control (unstimulated) sample. After TMT labeling, fractionation and enrichment steps, differentially phosphorylated peptides are identified and quantitated by comparing the reporter ion intensities in each of the ten TMT channels. Fold change of the phosphopeptides in each treated sample, compared to the untreated sample is then determined

