Figure 2.
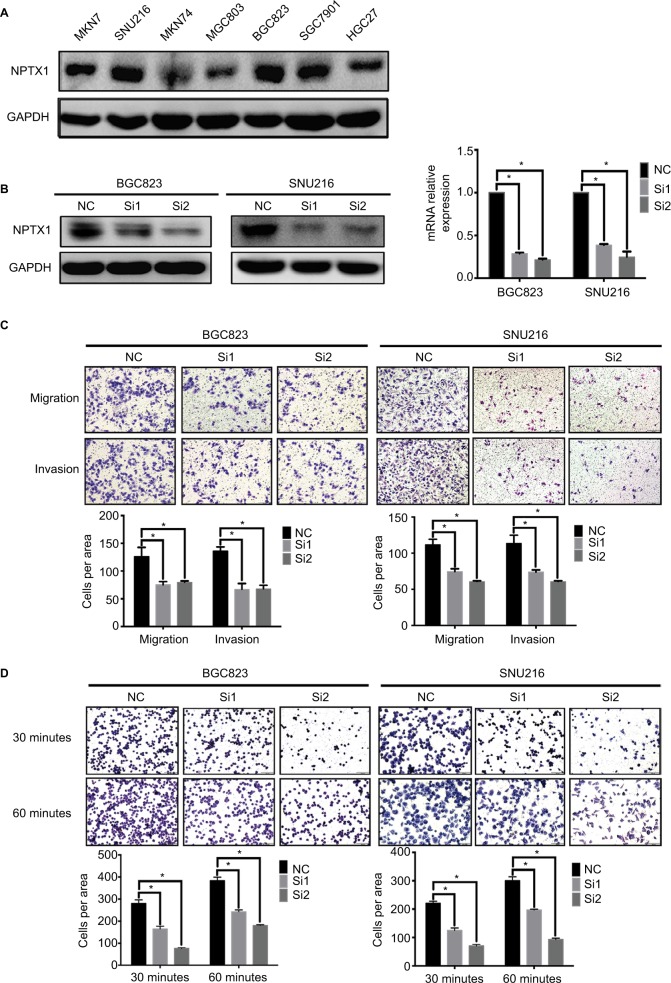
NPTX1 promotes migration, invasion, and adhesion in GC cells.
Notes: (A) Western blot of NPTX1 expression in GC cell lines. (B) Western blot was used to detect NPTX1 expression in BGC823 and SNU216 cells transfected with the siNC or the siNPTX1. (C) Transwell migration and invasion assays of BGC823 and SNU216 with transient NPTX1 knockdown (up panels). Quantifications of cells are shown as proportions of the number of control cells (down panels). Original magnification, 100×. Scale bar: 200 µM. (D) Adhesion assay of BGC823 and SNU216 with transient NPTX1 knockdown (up panels). Quantifications of cells are shown as proportions of the number of control cells (down panels). Original magnification, 200×. Scale bar: 100 µM. *P<0.05. GAPDH was used as a loading control in Western blot. Error bars represent the mean ± SD of three independent experiments.
Abbreviations: GAPDH, glyceraldehyde-3-phosphate dehydrogenase; GC, gastric cancer; NC, negative control.

