
Figure 1.
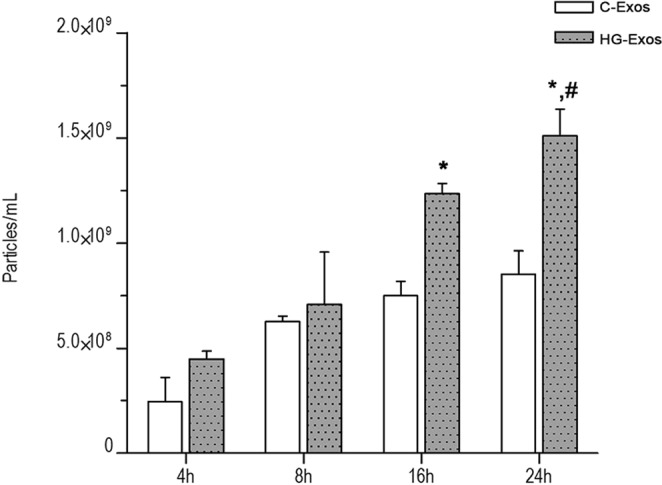
HG-treated HMCs secreted more exosomes than normal HMCs. Quantification of exosomes was normalized to the cell number by using the Countess® Automated Cell Counter. The number of exosomes was quantified by using Nanoparticle Tracking Analysis. Six separate flasks were used, and the exosome number was quantified from three video recordings. Error bars are plotted as s.e.m. *p < 0.05 versus the HG-Exos 4 hr group, #p < 0.05 versus C-Exos. C-Exos group: exosomes derived from normal glucose-treated HMCs (Student’s t-test); HG-Exos group: exosomes derived from HG-treated HMCs.