
Figure 2.
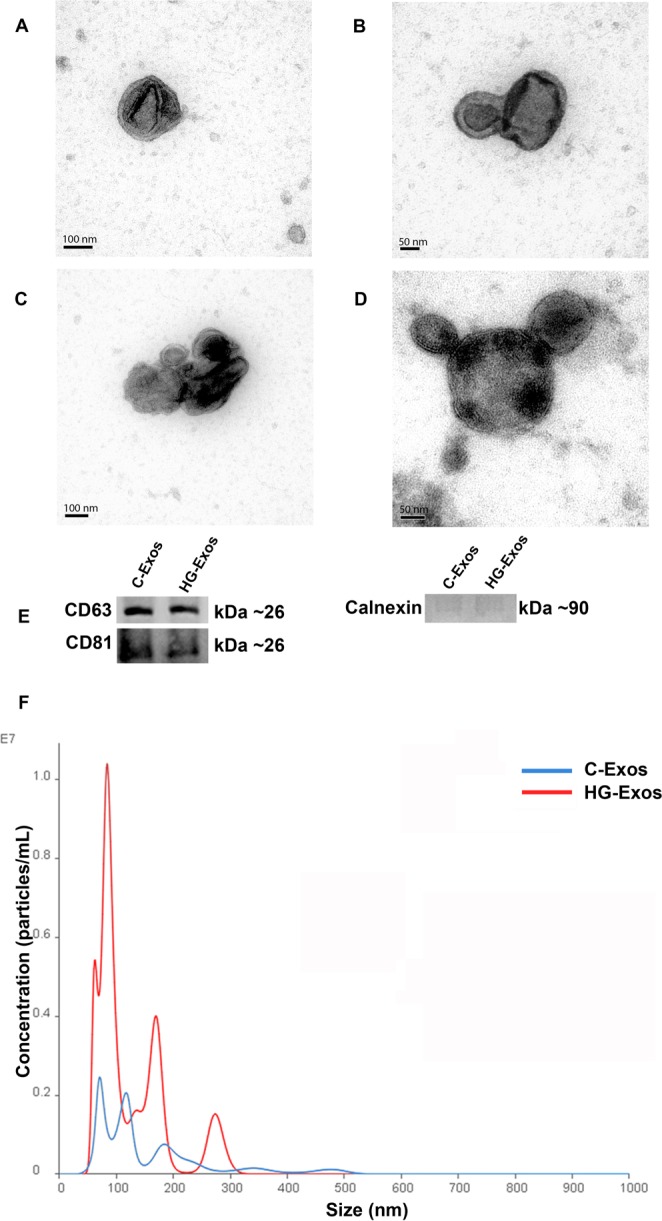
Exosomes characterization. (A) C-Exos. (B) HG-Exos. (C) C-Exos and (D) HG-Exos clusters with variable sizes. Images were obtained by transmission electron microscopy. Cup-shaped structures of 30–150 nm in size were identified as exosomes. Magnification: ×150,000. (E) Western blot analysis for exosome markers CD63 and CD81. (n = 3 for each index). (F) Histogram representing the profile of nanoparticle size by Nanoparticle Tracking Analysis. The values represent the means ± SEM, and all values are representative of at least three independent experiments.