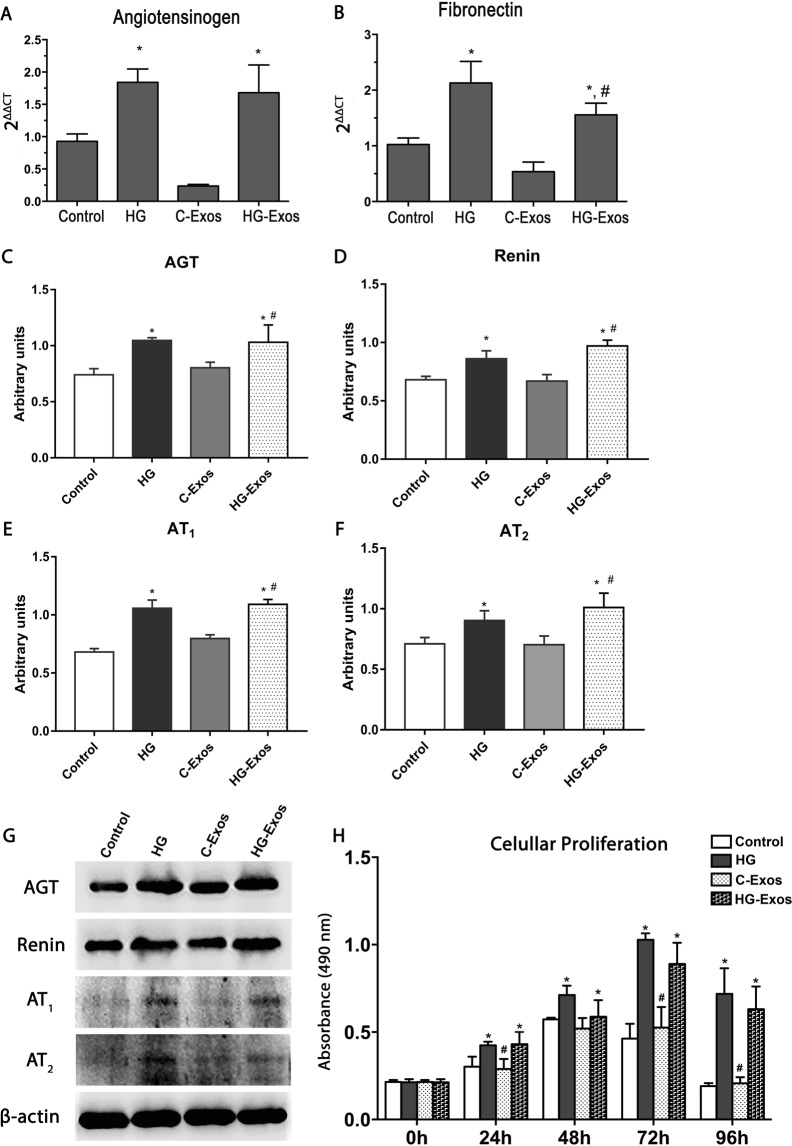
Figure 7.
Activation of normal HMC by high glucose and HG-Exos. Normal HMCs were incubated with high glucose, C-Exos or HG-Exos. After 24 h, the gene expression for angiotensinogen (AGT) (A) and fibronectin (B) was evaluated. Protein expression of AGT (C), renin (D), AT1 (E) and AT2 (F) in the cell extract was determined by western blotting. The image is representative of three independent experiments and is shown in the lower panel, while the densitometric analysis is shown in the graph. (G) Representative bands of AGT, Renin, AT1 and AT2 expression. β-actin was used as a loading control. (H) HMCs were stimulated with high glucose or treated with C-Exos or HG-Exos. After 0, 24, 48, 72 or 96 h, the cell proliferation was evaluated by 3-(4,5-Dimethylthiazol-2-yl)-2,5-Diphenyltetrazolium Bromide (MTT) (n = 3). The results are expressed as the means ± standard error of the mean (SEM). p < 0.05: * vs Control **p < 0.01 vs control group. ***p < 0.001 vs control group.; # vs C-Exos.

