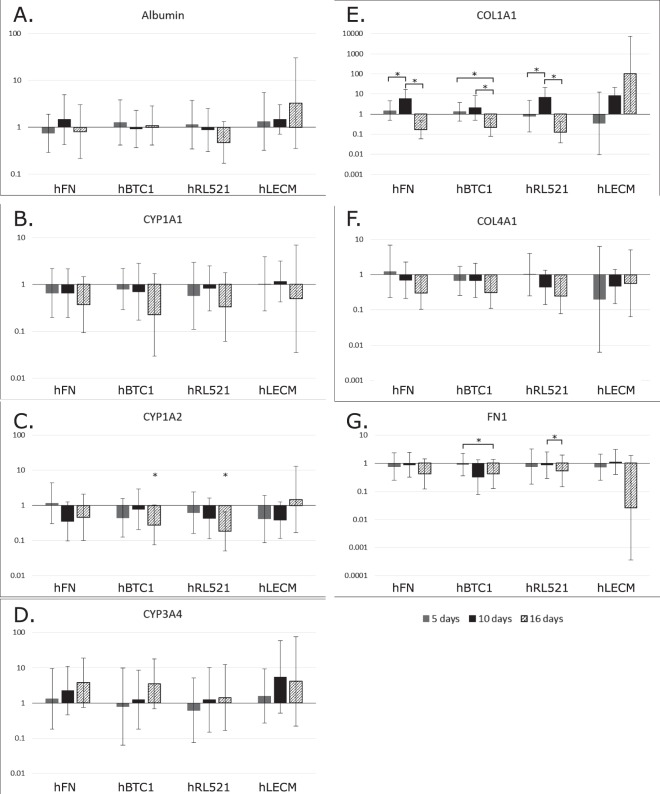
Figure 6.
Q-PCR of key hepatic genes. Quantitative analysis of gene expression was undertaken on the functional cell layer at five, ten and sixteen days of culture, compared to that of the same culture periods grown on polymer only scaffolds. mRNA levels of Albumin (A), Cyp1A1 (B), Cyp1A2 (C), CYP3A4 (D), Collagen I (E), and Collagen IV (F) and Fibronectin (G) are represented as fold difference relative to polymer only controls and relative to the housekeeping gene GAPDH. One-way ANOVA with Games Howell and Tukey post hoc testing and minimum n = 5. *p < 0.05 **p < 0.01, ***p < 0.001. Error bars = SD.

