Figure 1.
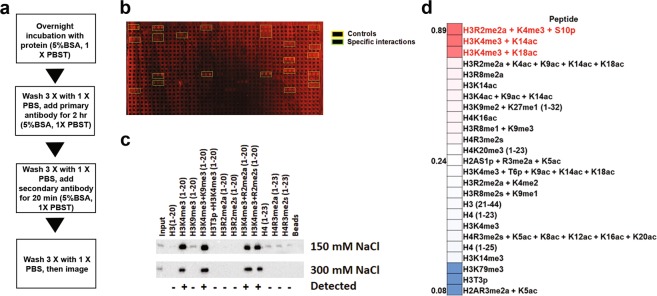
Peptide microarrays do not fully capture interactions detected by peptide pulldowns. (a) Flow chart for peptide microarray method. (b) Peptide microarray results with the DIDO1 PHD finger. Interactions observed for positive controls (IgG) and peptides are boxed in as indicated. (c) Heatmap diagram of top, middle, and bottom hits as sorted by values from quantification by the array for the DIDO1 PHD and with visible hits in red text. (d) Examination of the DIDO1 PHD finger in solution peptide pulldowns, using the indicated peptides as selected from array results and previous literature. Images are representative of array results for greater or equal to four experiments (i.e., n ≥ 4 subarrays). Heatmap represents the averages for indicated peptides as derived from the replicates of the array results. The average standard deviation for any given peptide was less than 10% and additional representative array images are also shown in Sup. Fig. S2c. Image of peptide pulldowns is representative of three pulldown experiments.

