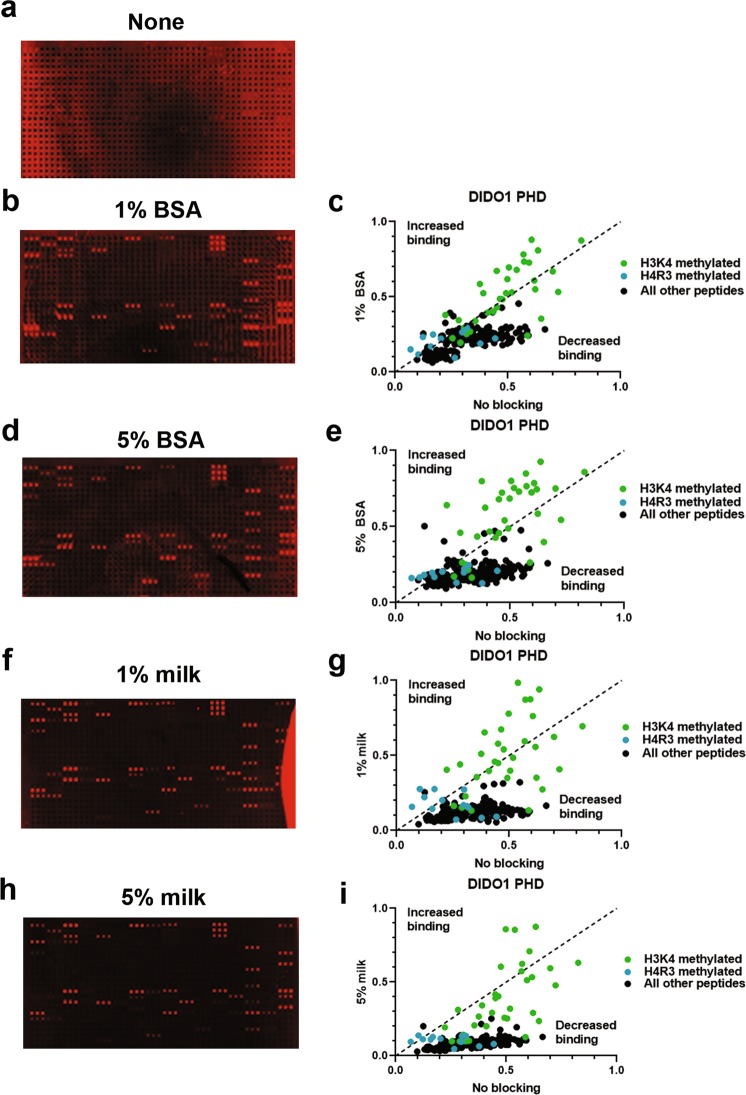
Figure 2.
Peptide microarray background is reduced when incubation steps are in 1% milk 1 X PBST. (a) DIDO1 PHD array without blocking during incubation steps. (b–e) A DIDO1 PHD array carried out in the presence of 1% (b) or 5% (d) BSA in 1 X PBST during incubation steps that were then quantified by normalizing to a 0–1 scale as described in Methods and compared to no blocking (c and e, respectively). (f–i) DIDO1 PHD array carried out in the presence of 1% (f) or 5% milk (h) in 1 X PBST during incubation steps that were then quantified and compared to no blocking (g and i, respectively). Array intensities were linearly adjusted to equivalent levels and are comparable to each other in the figure. Images are representative of array results for greater or equal to four experiments (n ≥ 4 subarrays); for additional representative results see Sup. Fig. S2a–e S2. For quantification, averages are shown for each peptide as derived from the replicates of the array results. The average standard deviation for any given peptide was less than 10%.

