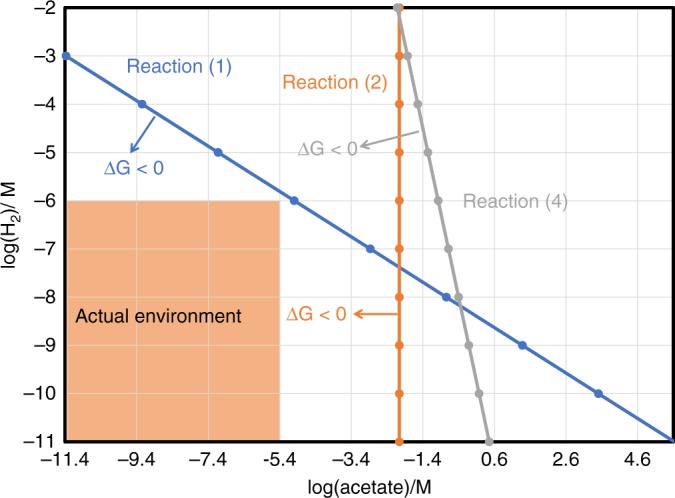
Fig. 5.

Thermodynamic constraints on anaerobic benzoate and hexadecane degradation. Three reactions (Reactions 1, 2, and 4) are illustrated as taken from Table 2 where ΔG > 0. Thermodynamics for each reaction are indicated by a line in its corresponding color. If ΔG < 0, the reaction is energetically favorable (indicated by arrow), and if ΔG > 0 the reaction is assumed not to occur. In the studied environment (outlined in the shaded area), hydrogen concentrations fall below 1 µM while acetate concentrations are below 2.5 µM. The graph shows that ΔG for three reactions are all negative when both actual concentrations of acetate and hydrogen are taken into consideration
