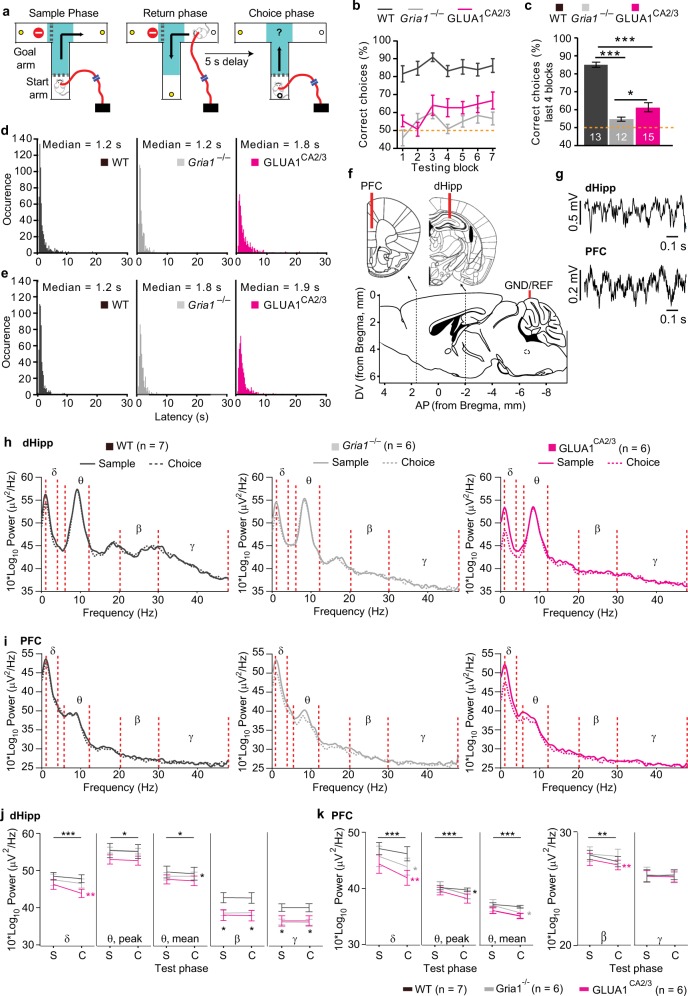
Fig. 1. Behavioral performance and local oscillations in dHipp and PFC during T-maze spatial working memory.
a Schematic of the phases of the T-maze, with the “decision zone” indicated by turquoise shading. b Spatial working memory (SWM) performance over the seven testing blocks in WT (black), Gria1–/– (gray), and GLUA1CA2/3 (magenta) animals and c SWM performance averaged over the last four testing blocks. Stars indicate pairwise differences (Tukey post-hoc test, conducted after significant effect of group in ANOVA). d, e Histograms showing the latency during the sample d and choice e phase for all T-maze trials. f Schematic of electrode placement and g example traces of LFP recordings from the dorsal hippocampus (dHipp) and prefrontal cortex (PFC). h, i Group-average power spectra showing sample (solid lines) and choice phase (dashed lines) oscillatory power changes in the dorsal hippocampus h and prefrontal cortex i. Frequency bands for delta (1–4 Hz; δ), theta (6–12 Hz; θ), beta (20–30 Hz; β), and gamma (30–48 Hz; γ) are indicated between red dotted lines. j, k Quantification of mean delta (δ), peak theta (θ), mean theta (θ), mean beta (β) and mean gamma (γ) power in the dHipp j and PFC k in the sample (S) and choice (C) task phase, as indicated. Stars on top line in each subpanel indicate significant effect of test phase across all three groups (repeated-measures ANOVA), whereas stars next to the line representing a specific group indicate significant effect of phase within that group, color-coded accordingly (paired t test), and black stars below data points indicate significant effect of group (one-way ANOVA). Error bars display SEM throughout. ***P < 0.001, **P < 0.01, *P < 0.05. N numbers for animals included in behavioral and electrophysiological analysis are stated in related panels c and h, k, respectively, for each group

