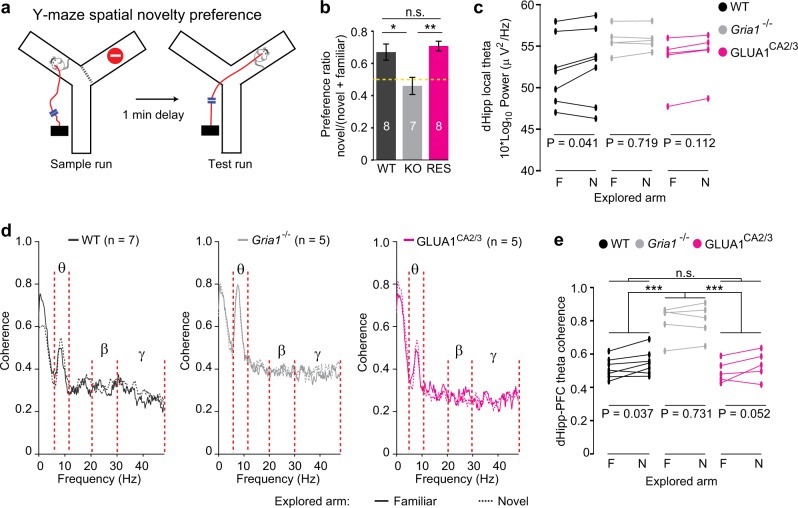
Fig. 5. Theta power and coherence reflect relative spatial novelty in the Y-maze.
a Schematic of spatial novelty preference (SNP) Y-maze task. b Novel arm preference ratio (time spent in novel goal arm divided by time spent in both goal arms) of WT (black), Gria1–/– (gray), and GLUA1CA2/3 (magenta) animals. Yellow dotted line indicates chance level performance. Stars indicate pairwise Tukey's post hoc tests conducted after a significant effect of group was found (P = 0.002; univariate ANOVA). N numbers are indicated within bars and error bars show SEM. c Average peak theta power in dorsal hippocampus during bouts exploring the familiar (F) vs. novel (N) Y-maze arm shown for each animal. d Coherence plots for bouts of exploration in the familiar (solid lines) versus novel (dashed lines) arm of the Y-maze during the test phase; with key frequency bands indicated (see also Supplementary Fig. 4). e Average peak theta frequency hippocampal–prefrontal coherence during bouts exploring the familiar (F) versus novel (N) Y-maze arm, shown for each animal. For c, e results of pairwise comparisons between groups (LSD post hoc test) are indicated above top lines, if a significant effect of group was found (repeated-measures ANOVA), whereas results of paired t tests within groups, comparing novel vs. familiar arm are indicated at the bottom of each graph. ***P < 0.001, **P < 0.01, *P < 0.05, n.s. P > 0.05. N numbers for animals used for electrophysiological analysis are indicated in d

