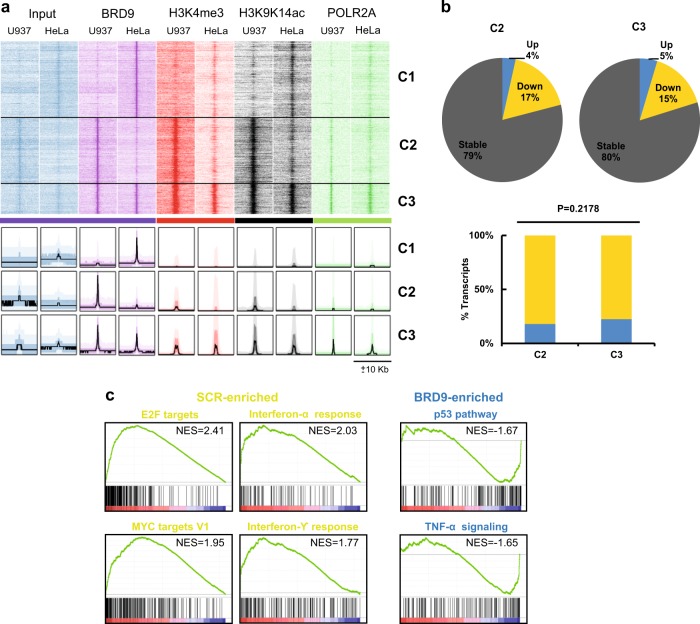
Fig. 5. Transcriptomic analysis identifies anti-proliferative and apoptotic pathways induced by BRD9 depletion.
a Genome-wide heatmap analysis indicating the co-occurrence of BRD9-binding sites with active chromatin regions. b Pie chart showing dominant gene silencing observed upon BRD9 KD for genes associated with C2 and C3, suggesting BRD9 as a transcription activator. However, there is no significant difference between numbers of activated and inactivated genes in C2 and C3 clusters. c GSEA analysis showing the top differential hallmark gene sets (nominal P < 0.05) associated with SCR and shBRD9 cells (NES = normalized enrichment score)

