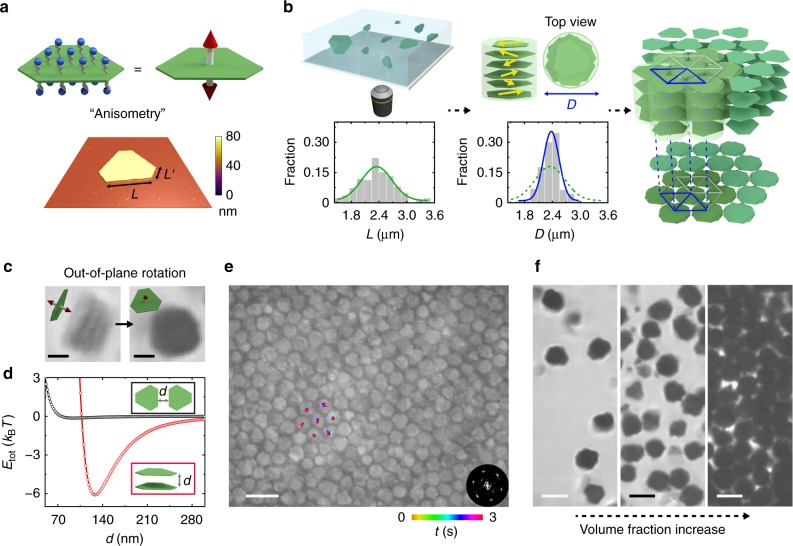
Fig. 1.
Hierarchical self-assembly of polydisperse, anisometric plates into a 3D lattice. a Top: schematics of anisometric silver plates (green) coated with thiolated COO‒ ligands (blue) and their directional attractions (red arrows). Bottom: a representative atomic force microscopy (AFM) scan over an anisometric plate. The color bar represents height. Scan area: 5 µm × 5 µm. b Schematics describing the hierarchical building process: plates first stack into columns (yellow arrows denoting the random orientations of the plates), which then assemble into a hexagonal lattice. The graphs below show the distribution of the long side length L of plates (left, green curve) and that of column projection diameter D (right, blue curve). The L distribution was rescaled so that and have the same value (2.36 µm) for direct comparison. c Time-lapse optical microscopy images and schematics showing the lying and standing orientations of the same rotating column. d Theoretical calculations of the net pairwise interactions Etot of two plates in the face-to-face (red circles) and side-by-side (black circles) configurations as a function of the plate‒plate distance d (labeled in inset schematic). e An optical microscopy image showing a hexagonal lattice, overlaid with tracked trajectories of the central positions of the column projections. The image was processed as detailed in Supplementary Fig. 5 and Supplementary Note 4. The bottom right inset is a fast Fourier transform (FFT) pattern of the image. f Optical microscopy images showing column arrangements as their concentration increases (from left to right). Ionic strength in c–f: 0.5 mM. The schematics were not drawn to scale. Scale bars: 1 µm in c; 5 µm in e; 3 µm in f

