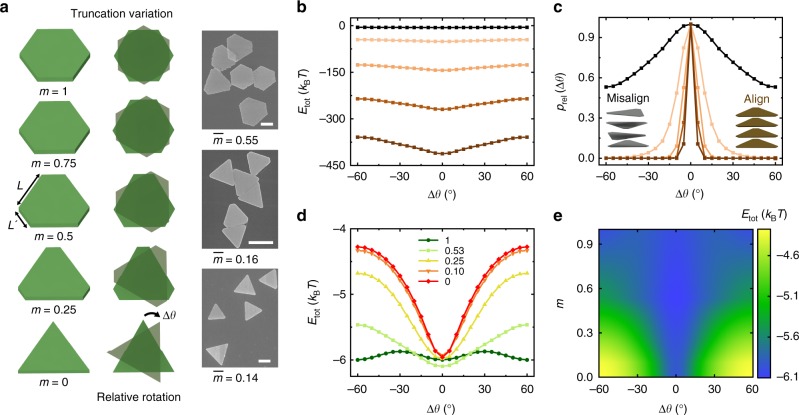
Fig. 3.
The effective shape of columns modulated by ionic strength or plate tip truncation. a Schematics (left) and SEM images (right) showing plates of a systematically varying extent of truncation m (defined as L′/L). The top right SEM image shows the plates used in the hexagonal lattice. The corresponding truncation distributions are shown in Supplementary Fig. 13. Scale bars: 1 µm. b A graph showing how the computed pairwise interaction Etot between two stacked plates (m = = 0.53, corresponding to the plates used for hexagonal lattice) changes as a function of Δθ at different ionic strengths (from top to bottom: 0.5, 1, 1.5, 2, and 2.5 mM, respectively). Note that 0.5 mM is used in the hexagonal lattice assembly. c Relative probability distributions of Δθ based on a Boltzmann distribution argument at different ionic strengths, computed from the interaction energy plot in b (color coded the same as in b). The inset schematics show misaligned plate orientations inside column (left) at low ionic strength (0.5 mM) and well-aligned plate orientations (right) at high ionic strength (2.5 mM). d A graph showing how the computed pairwise interaction Etot between two stacked plates changes as a function of Δθ at different extent of truncation m as labeled. Here the calculations are conducted at a fixed basal plane area (3.27 µm2). Ionic strength: 0.5 mM. e Pairwise interaction strength as a function of Δθ and truncation m at their energy minimum spacing d. Ionic strength: 0.5 mM

