Fig. 2.
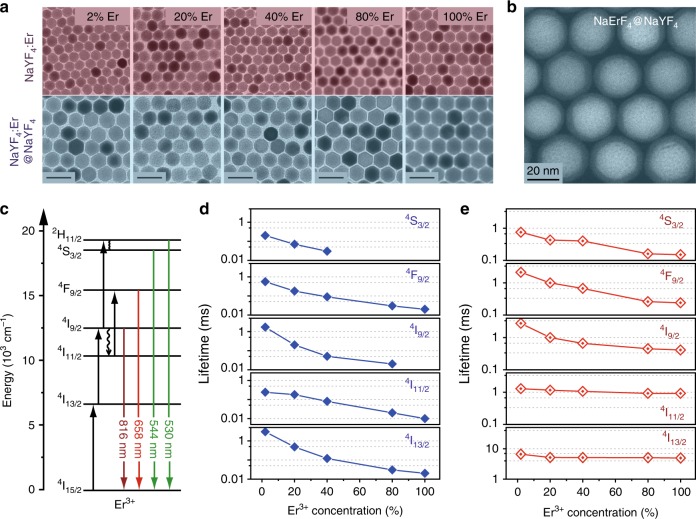
Comparative characterization of the NaYF4:Er and NaYF4:Er@NaYF4 nanocrystals. a TEM images of the NaYF4:Er (2−100%) core and the NaYF4:Er (2−100%)@NaYF4 core−shell nanocrystals. Scale bars are 50 nm. b HAADF scanning TEM image of the NaErF4@NaYF4 nanoparticle highlighting the core−shell structure. c Proposed energy diagram showing upconversion processes in Er3+ under 1532 nm excitation. The full, wavy, and colored arrows represent excitation, multiphonon relaxation, and emission processes, respectively. d, e Lifetimes of various excited states of Er3+ as a function of the dopant concentration in the NaYF4:Er (2−100%) core and the NaYF4:Er (2−100%)@NaYF4 core−shell nanoparticles, respectively. The excitation pulse energy density was set at 1 mJ mm−2 for decay measurements

