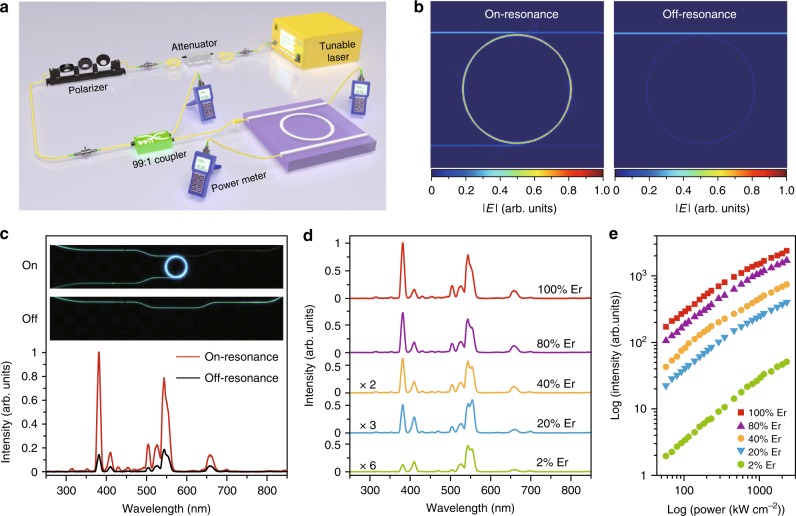
Fig. 4.
Microring resonator-assisted excitation of NaErF4@NaYF4 nanocrystals. a Schematic diagram of the set-up for the microring resonator-assisted excitation scheme. b Electrical field distribution in the waveguide structure when the incident light is in resonance (left) and out of resonance (right) with the microring resonator. c Emission spectra and optical micrographs (inset) recorded from an identical specimen in different resonance states. d Emission spectra of NaYF4:Er (2−100%)@NaYF4 nanoparticles as a function of Er3+ concentration under microring resonator-assisted excitation (1549.47 nm, 2300 kW cm−2). e Upconversion emission intensity at 382 nm as a function of excitation power density for NaYF4:Er (2−100%)@NaYF4 on microring resonator, demonstrating attenuation of UV emission with decreasing Er3+ contents

