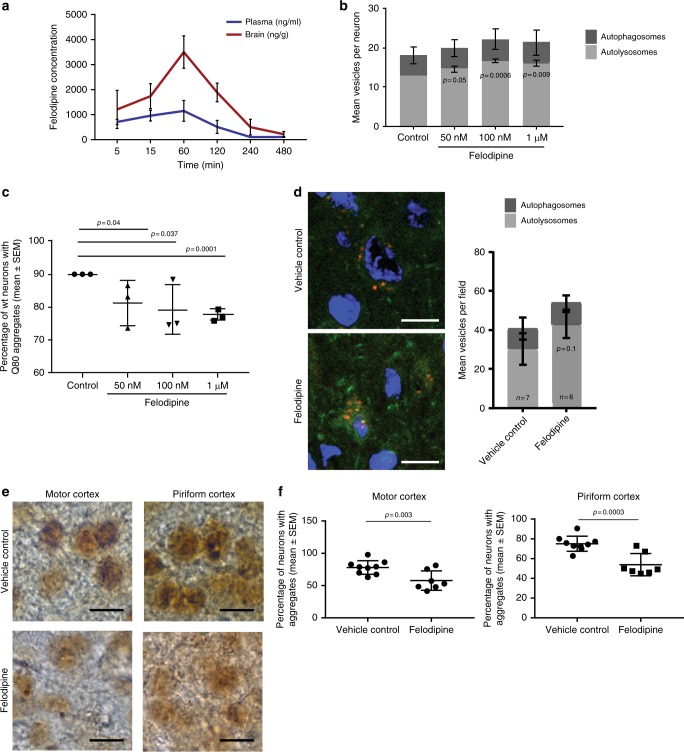
Fig. 4.
Felodipine pharmacokinetics and bioavailability. a Plasma and brain felodipine concentrations at 0, 5, 10, 60, 120, 240, and 480 min after single i.p. injection of 5 mg/kg body weight of felodipine in C57Bl6 wild-type mice, n = 3 mice per time-point. Means +/− SEM. b Felodipine (50 nM, 100 nM and 1 μM) in primary cortical neurons from mRFP-GFP-LC3 mice. Mean numbers of vesicles +/− SEM per neuron normalised to number of autolysosomes in DMSO (control); one sample, one-tailed unpaired t-test; exact p values for comparison of autolysosome numbers are shown. c Percentages of EGFP-positive neurons with aggregates (means +/− SEM (n = 3 independent experiments)). Data normalised to DMSO control in each experiment, set at 90. One-tailed unpaired t-test. d–f Double transgenic mRFP-GFP-LC3/B6HD male mice were implanted with felodipine-loaded minipumps (5 mg/kg/day) with 0.25 μl/h flow rate for 28 days. d Felodipine treatment increased the number of autolysosomes. Mean values +/− SEM; mean values for each vesicle type (autophagosomes, autolysosomes and total vesicles) for felodipine were compared with the same vesicle type of vehicle control, one-tailed unpaired t-test; exact p values are shown for autolysosomes. Only mice expressing detectable fluorescence of the mRFP-GFP-LC3 transgene were included in the final analysis. Representative images of cerebral cortex—scale bar = 10 µm. e Representative images of huntingtin inclusions in motor and piriform cortices. Scale bar = 10 µm. f Felodipine significantly reduced the percentage of cells with aggregates in both regions. Data are mean percentage of cells with aggregates per field with +/− SEM, using one-tailed unpaired t-test; exact p values for felodipine vs. vehicle control for each region are shown

