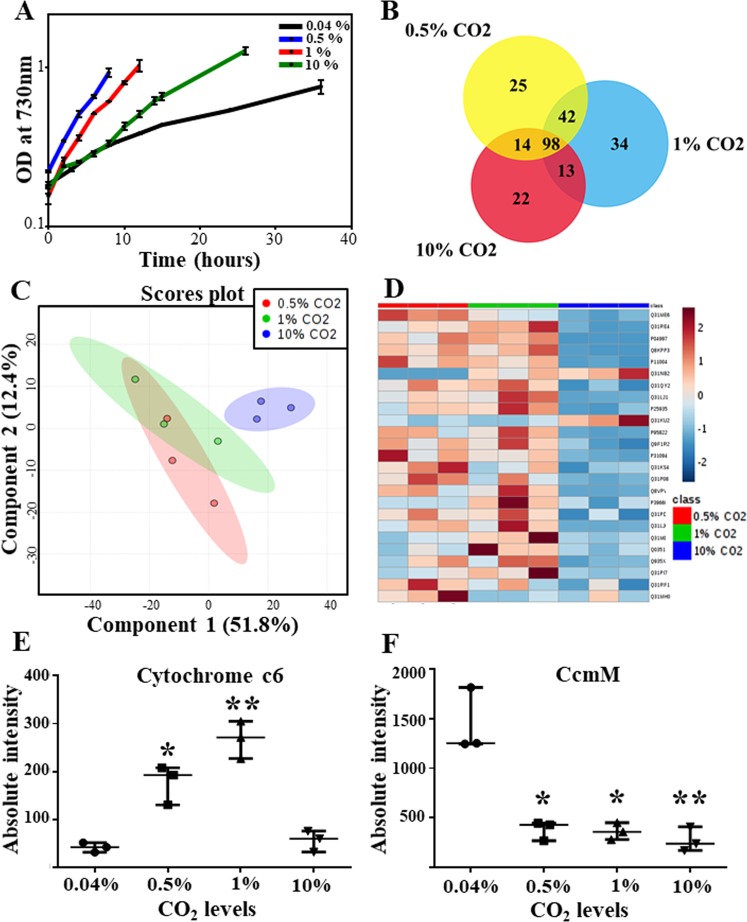
Figure 2.
Bioinformatics analysis of differentially expressed proteins. (A) Growth curve of Synechococcus 11801 at different CO2 concentrations at 38 °C and 400 µE in shake flasks. (B) Venn diagram showing the distribution of differentially expressed proteins among the three different CO2 conditions (0.04%, 0.5% and 10% CO2). (C) PLS-DA plot is showing segregation among the three high CO2 groups based on the protein fold ratio values in each group. The three points in each data group represent the three independent biological replicates. (D) Heatmap demonstrating the fold ratio of 25 differentially altered proteins with respect to the expression at ambient CO2 levels. (E,F) Scatter plots with n = 3 (expressed as median with range) showed an overall change in the expression pattern of cytochrome c6 and CcmM protein, respectively, with an increase in CO2 levels. Unpaired t-test with Welch’s correction was carried out for the comparison of the three high CO2 conditions with the ambient condition, with p-value < 0.05 considered significant. The following p-values were obtained; Cytochrome c6- 0.012 (0.5% CO2 vs. 0.04% CO2), 0.0034 (1% CO2 vs. 0.04% CO2), 0.1993 (10% CO2 vs. 0.04% CO2) and CcmM- 0.0115 (0.5% CO2 vs. 0.04% CO2), 0.0117 (1% CO2 vs. 0.04% CO2), 0.0079 (10% CO2 vs. 0.04% CO2).

