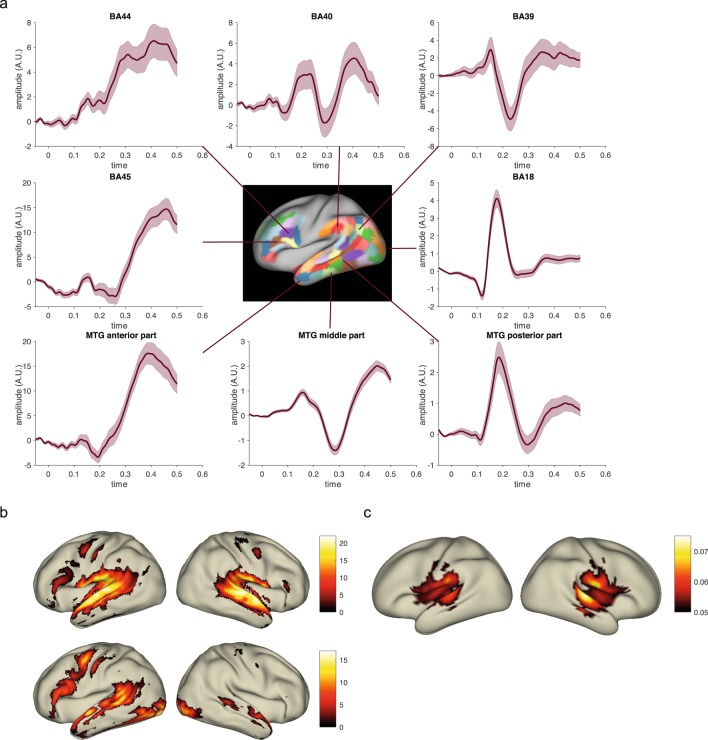
Fig. 3.
Group-level results obtained from the data. (a) MEG source-level event-related response to visual word onset for a set of highlighted cortical parcels (mean +/− SEM, n = 102, minimum norm estimate). BA = Brodmann Area, MTG = middle temporal gyrus. (b) fMRI statistical parametric maps for the contrast activation versus baseline, thresholded at a T-value of 0, for the auditory subjects (upper panels: n = 102) and for the visual subjects (lower panels: n = 102). (c) MEG source-level maps of delta frequency (1–3 Hz) entrainment of the brain activity to the acoustic envelope (n = 102, beamformer based coherence estimation).

