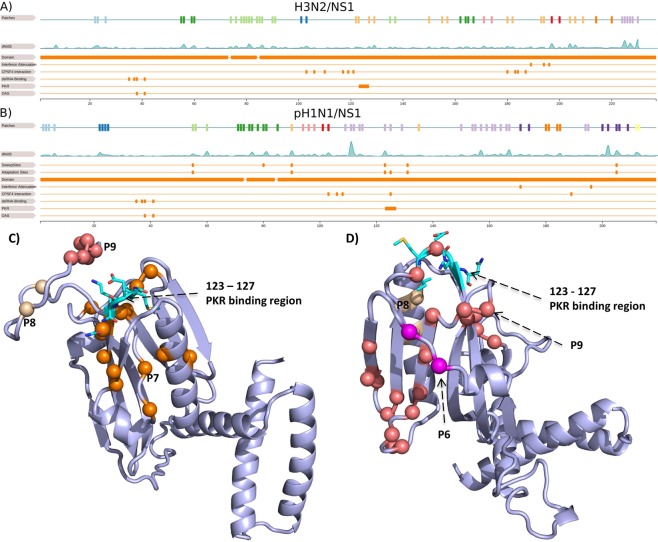
Figure 3.
Structural and linear representation of NS1 patches. The NS1 models for H3N2 in (A) and pH1N1 in (B) are shown as cartoon in light blue with the PKR binding region51,61,62 shown as sticks and colored by atom-type (cyan for carbon, red for oxygen and blue for nitrogen). We highlight patches in the surrounding region of the PKR binding region with a major focus on patch 7 in H3N2 and patch 9 in pH1N1. In (C,D), the first row is a linear representation of patches and the second row shows the dN/dS distribution of H3N2/NS1 and pH1N1/NS1. The third and fourth row in (D) show sweep-related sites16 and adaptations sites57 in pH1N1/NS1. Remaining rows in both subfigures depict the protein domains52,53, interferon attenuation sites52,59,60, CPSF30 interaction sites51,55,56, dsRNA binding sites7,63, PKR51,61,62 and OAS binding sites51,63. Information about protein models is listed in Supplementary Tables 1 and 2.

