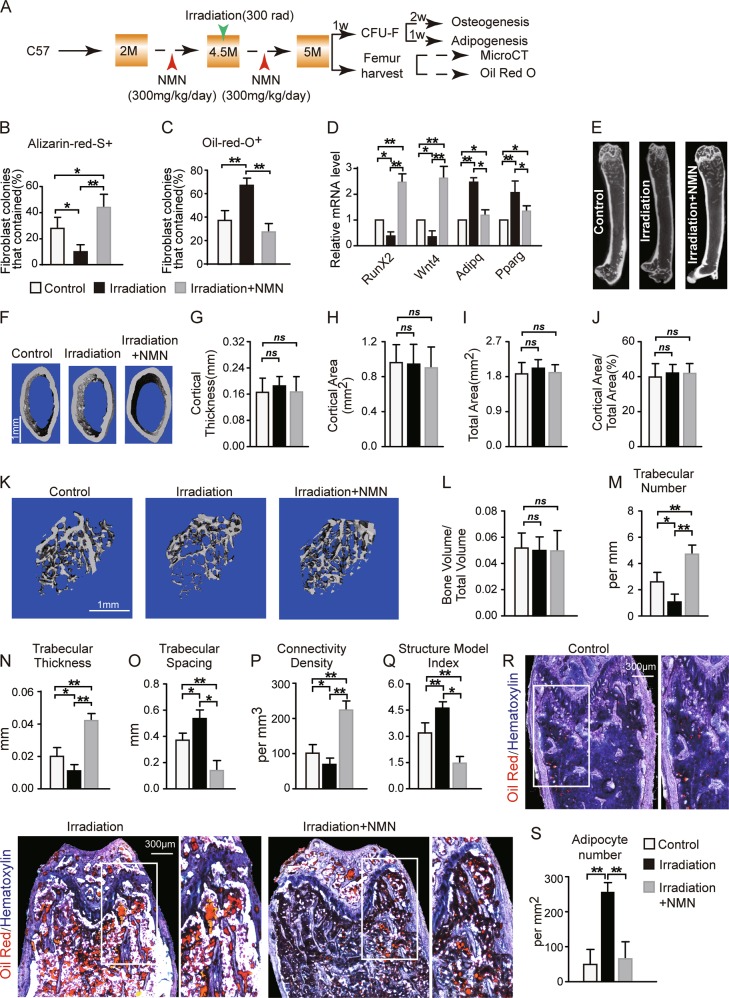
Fig. 6. NMN increases osteogenesis but decreases adipogenesis in adult mice under irradiation.
a Scheme of NMN administration and downstream assays. b–c The percentage of fibroblast colonies that contained osteogenesis (b) and adipogenesis (c) differentiation of CFU-Fs are d qPCR analysis of expression for regulatory genes of osteogenic and adipogenic differentiation in LepR+CD45−Ter119−CD31− cells from 5-month-old NMN-treated and control mice (n = 3 independent experiments). e–f Representative µCT images showing vertical (e) and cross (f) sections of whole femur. g–j µCT analyses of the cortical bone thickness (g), cortical bone area (h), total area (i), and cortical bone area/total area (j) in the femur metaphysis (n = 6 mice per group from six independent experiments). k Representative µCT images showing trabecular bone from the femur metaphysis. l–q µCT analyses of the percentage of trabecular bone volume out of total volume (l), trabecular number (m), trabecular thickness (n), trabecular spacing (o), connectivity density (p), and structure model index (q) in the femur metaphysis (n = 6 mice per group from six independent experiments). r–s Representative Oil Red S and hematoxylin staining in femur sections (r) and quantification of the adipocyte number (s) (n = 6 mice per group from six independent experiments). *p < 0.05, **p < 0.01 error bars, s.d.

