Fig. 2.
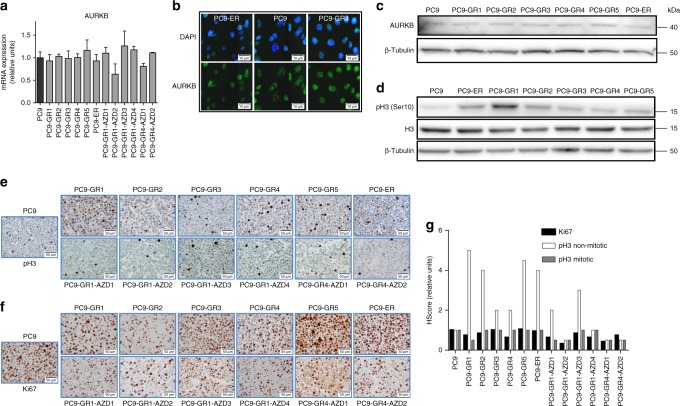
AURKB and pH3 in PC9-derived cell lines resistant to EGFR TKIs. a Levels of AURKB mRNA in the cells of the panel. Values shown are means ± SD of three independent determinations (n = 3). b Levels of AURKB by ICC in the parental PC9 and the resistant lines PC9-ER (p.T790M negative) and PC9-GR4 (p.T790M positive). Scale bars indicate 10 μm. c Levels of AURKB in the parental PC9 and the cell lines resistant to first generation EGFR TKIs by western blotting. d Levels of histone H3 and pH3 in the same cell lines by western blotting. e–g IHC of pH3 (e), Ki67 (f) and H-score of Ki67, mitotic pH3 and non-mitotic pH3 (g) in the 12 cell lines resistant to EGFR TKIs. Scale bars indicate 50 μm. Values shown are means of two blind determinations performed independently by two expert pathologists (n = 2)

