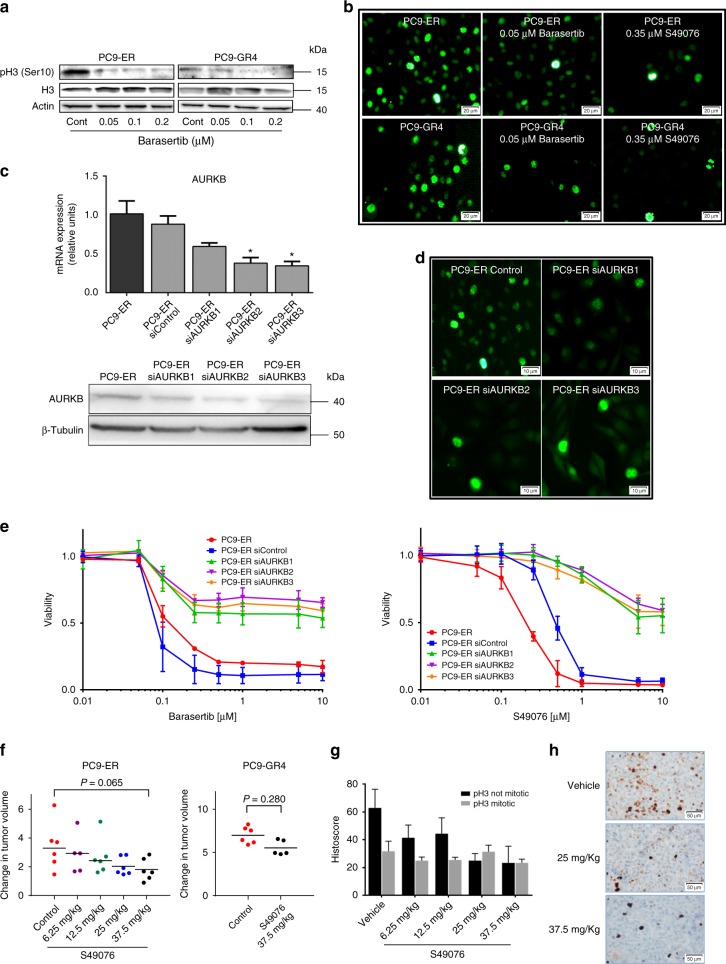
Fig. 3.
Inhibition and silencing of AURKB in cells and xenografts resistant to EGFR TKIs. a Western blot showing the dose-dependent decrease of pH3 levels induced by barasertib at 24 h in PC9-ER and PC9-GR4 cells. b ICC showing the inhibition of non-mitotic pH3 by barasertib and the MET/AXL/FGFR/AURKB inhibitor S49076 after 24 h in PC9-ER and PC9-GR4 cells. Scale bars indicate 20 μm. c Levels of AURKB mRNA (upper panel) and protein (lower panel) in clones with partial silencing of the AURKB gene (PC9-ER siAURKB1–3), compared to parental PC9-ER and PC9-ER cells transfected with a control lentivirus (PC9-ER siControl). Results shown are means ± SD of three independent determinations (n = 3) and asterisks indicate statistical significance (p < 0.05) in a two-sided Student’s t-test. d ICC showing the inhibition of non-mitotic pH3 in clones with partial silencing of the AURKB gene. Scale bars indicate 10 μm. e Dose-response curves to barasertib (left) and S49076 (right) of the parental PC9-ER and the PC-ER clones with partial silencing of AURKB. Values shown are means ± SD, experiments were conducted in tri (n = 3) or quadruplicates (n = 4). In each experiment, every concentration of drug was tested in sextuplicates (n = 6). f Effects of S49076 on the growth of subcutaneous PC9-ER (left panel) and PC9-GR4 (right panel) xenografts. Each point represents an individual tumor. Tumor dimensions were measured three times per week by digital calipers and volumes estimated according to the formula V = π/6 × L × W2, where L is the long axis and W is the short axis of tumor, respectively. Values are expressed as the fold-change in volume of each individual tumor after the 21 day treatment (n = 6 tumors per group). Lines indicated medians, and numbers correspond to levels of significance (p) in a Mann–Whitman U test. g H-scores of mitotic and non-mitotic pH3 in the tumor xenografts. Values shown are means ± SD (n = 6 tumors per group). H-scores of every tumor were evaluated independently by two expert pathologists (n = 2). h pH3 immunostaining of representative tumor xenografts

