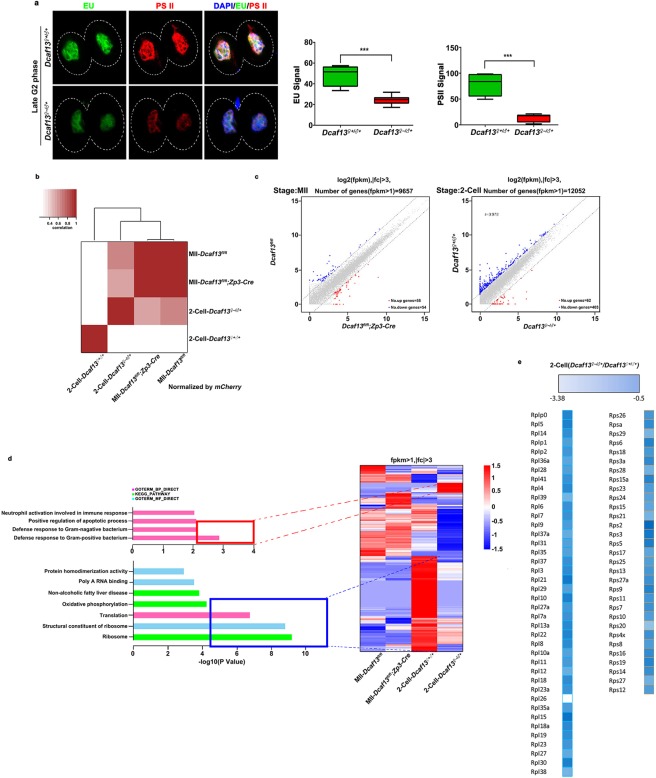
Figure 3.
Maternal DCAF13 affects zygotic genome activation by the two-cell stage. (a) Detection of newly synthesized RNA by 5-ethynyl uridine (EU) (in green) incorporation and the activity of polymerase II (POLII) (PSII in red) in two-cell embryos of Dcaf13♀+/♂+ or Dcaf13♀−/♂+ is shown (top), and the measurement of the intensity was indicated (bottom). Scale bar, 20 µm. *** to p < 0.001. Dcaf13♀+/♂+ (n = 10), Dcaf13♀−/♂+ (n = 10). (b) Heat map and cluster tree represented the relative mRNA levels of total transcripts in Dcaf13fl/fl and Dcaf13fl/fl;Zp3-Cre MII oocytes as well as Dcaf13♀+/♂+ or Dcaf13♀−/♂+ two-cell embryos. (c) Gene scatter plots showed that transcript levels increasing more than three folds in Dcaf13fl/fl;Zp3-Cre MII oocytes (Dcaf13fl/fl;Zp3-Cre/Dcaf13fl/fl > 3) were upregulated (red); Transcript levels decreasing more than three folds (Dcaf13fl/fl/Dcaf13fl/fl;Zp3-Cre > 3) were downregulated (blue) (top). Transcript levels increasing more than three folds in Dcaf13♀−/♂+ two-cell embryos were upregulated (red); transcript levels decreasing more than three folds in Dcaf13♀−/♂+ two-cell embryos were downregulated (blue) (bottom). (d) Gene ontology (GO) analysis plot and heat map indicated the function of transcripts whose levels increased (red) or decreased (blue) in Dcaf13♀−/♂+ two-cell embryos compared to control. (e) Heat map described the level change of transcripts encoding ribosomal proteins grouped by ribosome large and small subunit in Dcaf13♀−/♂+ two-cell embryos. The fold changes (Dcaf13♀−/♂+/Dcaf13♀+/♂+) were listed at the top of the boxes from white to blue (from large to small).

