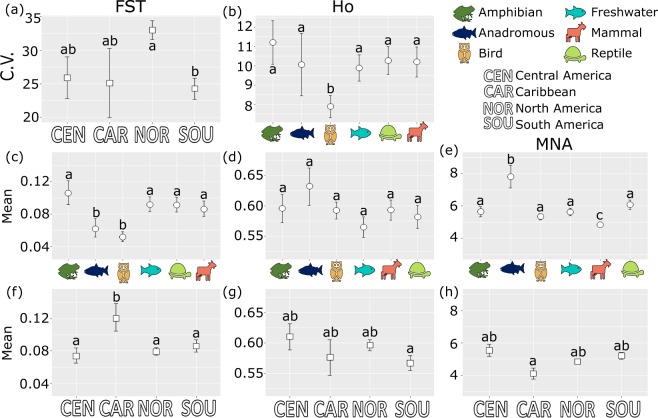
Fig. 1.
Coefficient of variation and mean values for observed heterozygosity (HO), mean number of alleles (MNA), and population-specific FST calculated to account for GLMM structure. Error bars represent standard error. Significant differences between groups indicated by letter grouping where groups sharing the same letter(s) are not significantly different from one another. (a,b) Coefficient of variation calculated across (a) taxonomic groups (circles) and (b) between continental regions (squares). (c–e) Mean (c) FST, (d) Ho, and (e) MNA calculated across taxonomic groups. (f–h) Mean (f) FST, (g) Ho, and (h) MNA calculated between continental regions.

