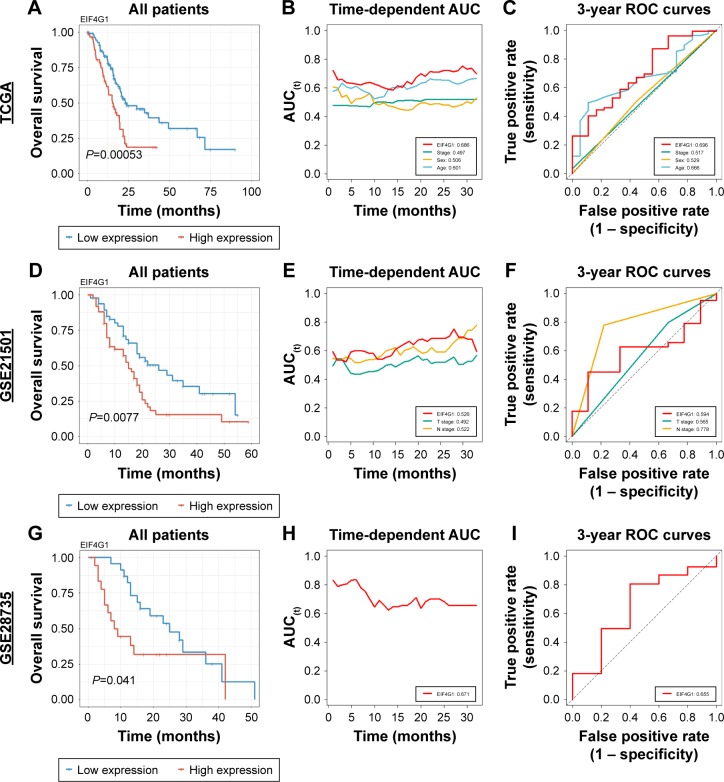
Figure 2.
Survival analyses of EIF4G1 in 3 independent cohorts.
Notes: Kaplan–Meier estimates of all patients in TCGA (A), GSE21501 (D), and GSE28735 (G) according to EIF4G1 expression. Time-dependent AUC of EIF4G1 with clinical variables in TCGA (red, EIF4G1; green, stage; yellow, sex; and blue, age) (B), GSE21501 (red, EIF4G1; green, T stage; and yellow, N stage) (E), and GSE28735 (red, EIF4G1) (H). The 3-year ROC of EIF4G1 with clinical variables in TCGA (red, EIF4G1; green, stage; yellow, sex; and blue, age) (C), GSE21501 (red, EIF4G1; green, T stage; and yellow, N stage) (F), and GSE28735 (red, EIF4G1) (I).
Abbreviations: AUC, area under the curve; ROC, receiver operating characteristic; TCGA, The Cancer Genome Atlas.

