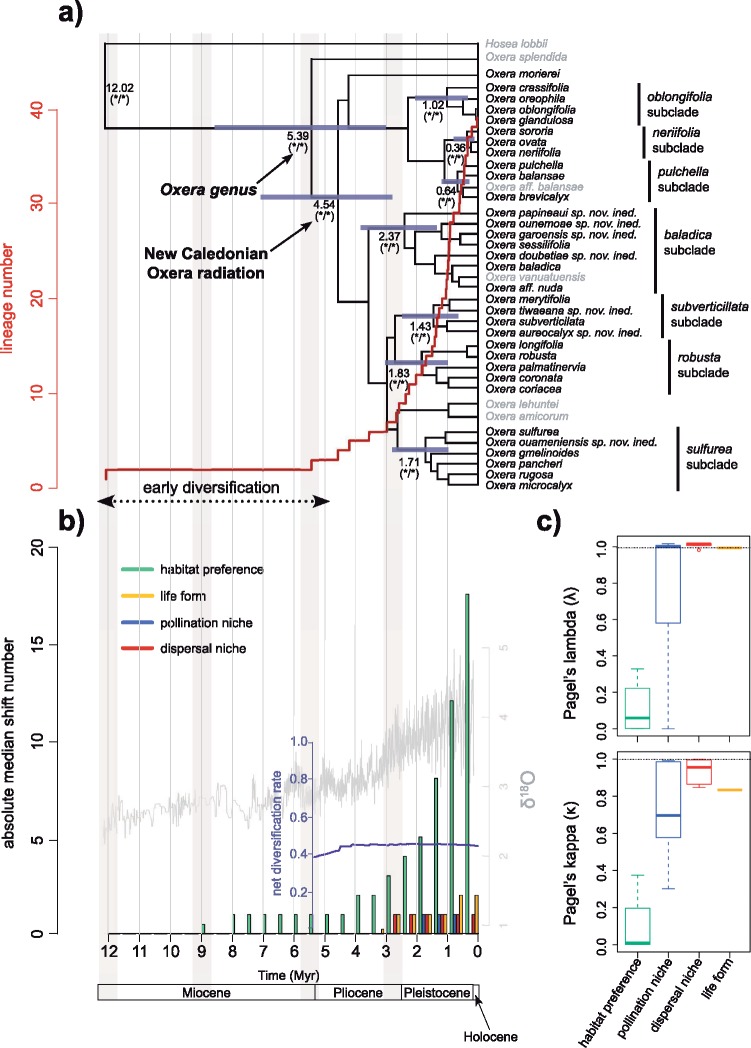
Figure 2.
Evolutionary history of Oxera in New Caledonia, and of its habitat preferences, pollination and dispersal niches, and life forms. a) BEAST chronogram of the Oxera data set with superimposed lineage through time plot. Median age estimates and blue node bars (corresponding to the 95% highest posterior densities) are indicated for each node of interest. Bayesian PP from the BEAST analyses (on the right) and MCMC Bayesian analyses (on the left) are indicated with an asterisk for each node of interest when  0.95, and with a hyphen when
  0.95. Vertical light grey rectangles indicate periods of intense weathering as inferred from Chevillotte et al. (2006). b) Absolute shift timings of the three niches and life forms inferred from stochastic character mappings, with global delta
  O variation through time (in grey; from Zachos et al. 2001) and net diversification rate variation through time of Oxera, as inferred from BAMM analyses (in dark blue), superimposed. c) Phylogenetic signal for habitat preferences, pollination and dispersal niches, and life forms inferred from estimations of the
  and
and  Pagel statistics.

