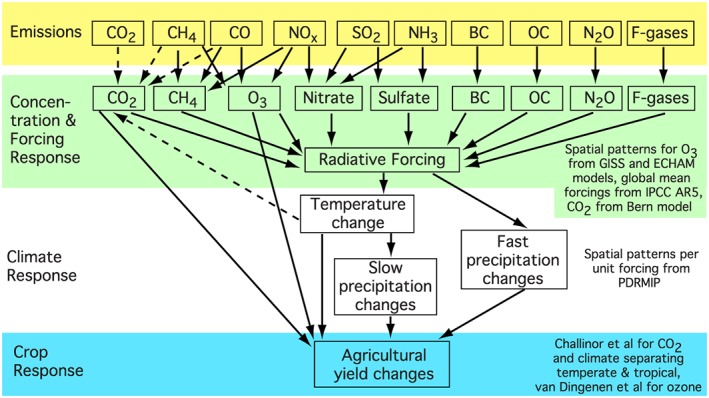
Figure 1.

Diagram of processes included in the model. Dashed arrows indicate processes that are part of the carbon cycle (direct impacts, meaning via CO2 emissions or oxidation to CO2, are downward arrows whereas indirect impacts, meaning via the carbon cycle response to temperature, are represented by the upward arrow). Text at right provides overview of inputs to each step of the modeling, with further details given in the main text. The Bern carbon cycle model is that of Joos et al. (2001). Sulfate and nitrate represent ammonium sulfate and ammonium nitrate, respectively.
