
Figure 2.
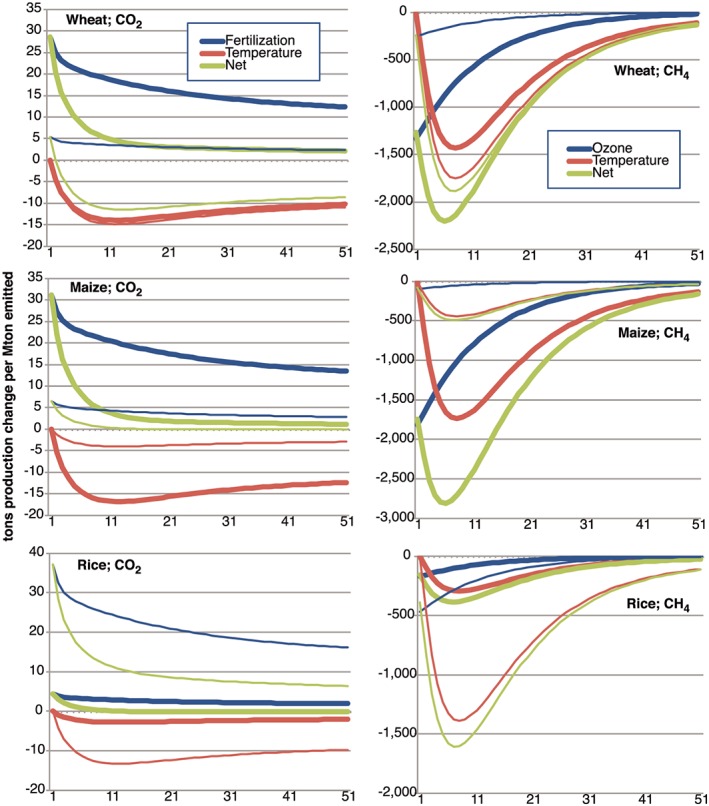
Tons of annual production change by year (relative to year of a single‐year pulse emission) summed over temperate regions (thick lines) and tropical regions (thin lines) per Mt carbon dioxide (left) or methane (right) emission by process. Note the impacts of temperature changes induced by CO2 on wheat are nearly identical for the temperate and tropical regions (so that the lines fall largely on top of one another). Values assume present‐day cultivated areas.