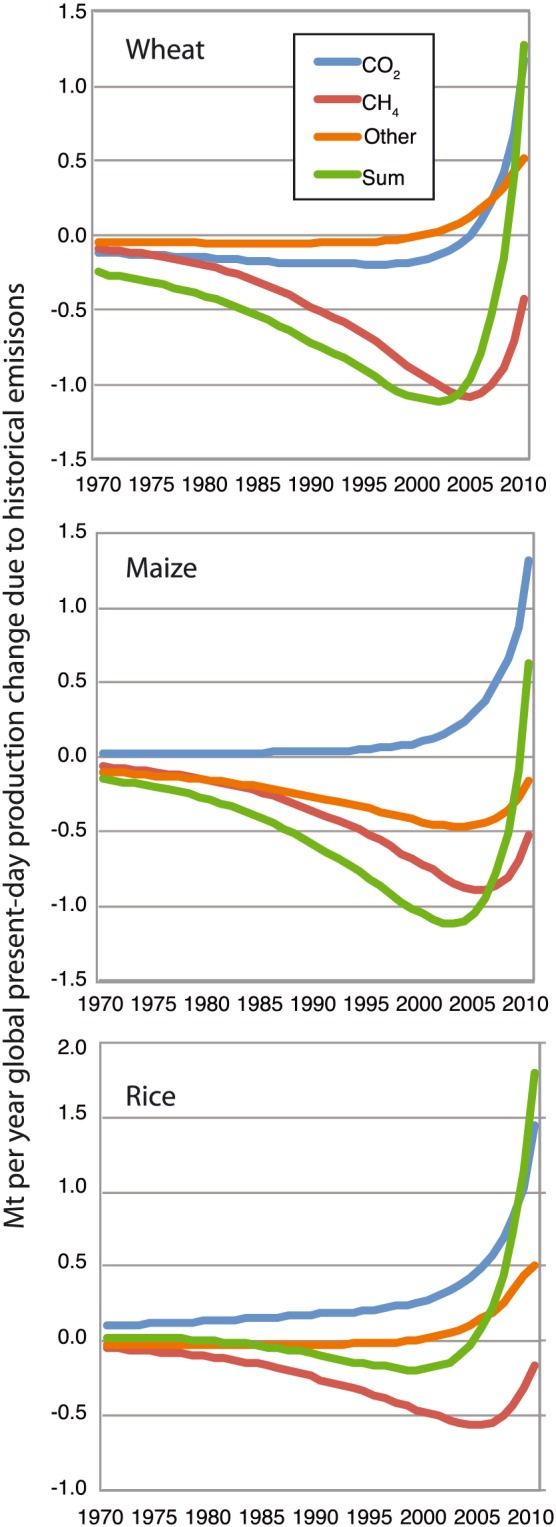
Figure 3.

Mt per year global production change in 2010 for the indicated crops due to historical emissions by year from 1970 to 2010. Integrating the area under the curve (over all historical time) would yield the global totals in Table 1.

Mt per year global production change in 2010 for the indicated crops due to historical emissions by year from 1970 to 2010. Integrating the area under the curve (over all historical time) would yield the global totals in Table 1.