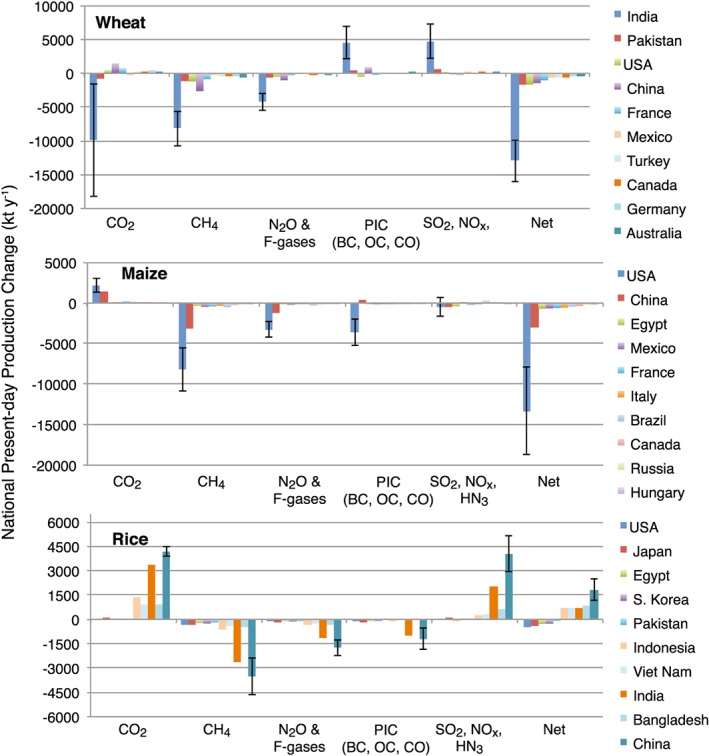
Figure 5.

National level present‐day crop production changes in response to historical emissions for the 10 countries with greatest net losses (maize and wheat) or the five greatest losses and five greatest gains (rice). PIC stands for products of incomplete combustion. Uncertainties are 95% confidence intervals and shown for the lead country only for clarity but are roughly proportional for other countries for each pollutant set.
