Figure 6.

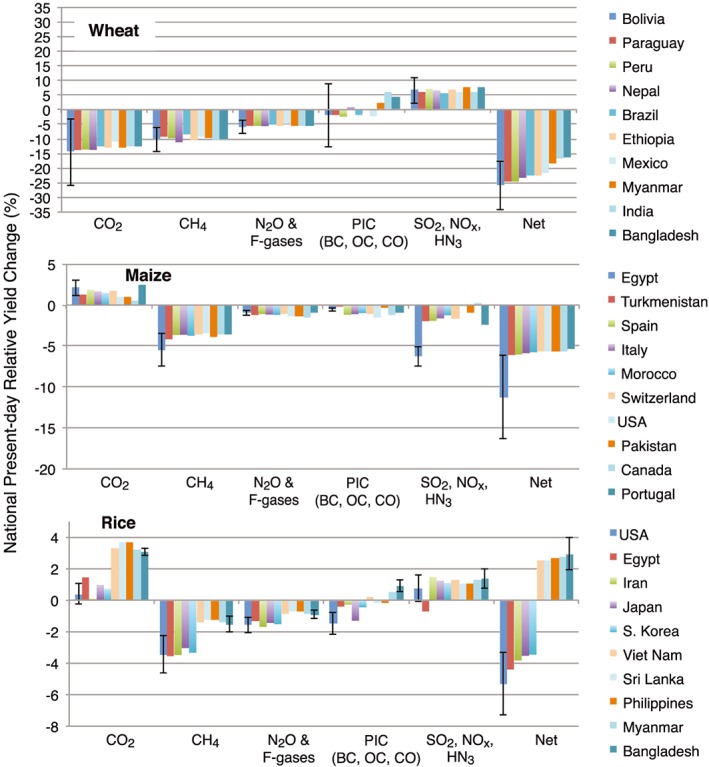
National level present‐day crop yield changes in response to historical emissions as in Figure 5 but ranking by relative (rather than absolute) losses.

National level present‐day crop yield changes in response to historical emissions as in Figure 5 but ranking by relative (rather than absolute) losses.