Figure 8.

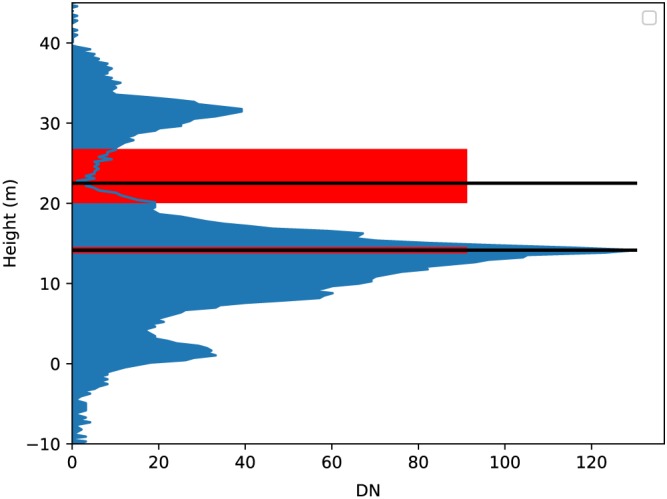
Illustration of distance a 2% change in energy can cause for relative height metrics at points of high and low waveform intensity. Black lines mark RH50 and RH80. Red boxes indicate a shift that would result with a ±2% energy change.

Illustration of distance a 2% change in energy can cause for relative height metrics at points of high and low waveform intensity. Black lines mark RH50 and RH80. Red boxes indicate a shift that would result with a ±2% energy change.