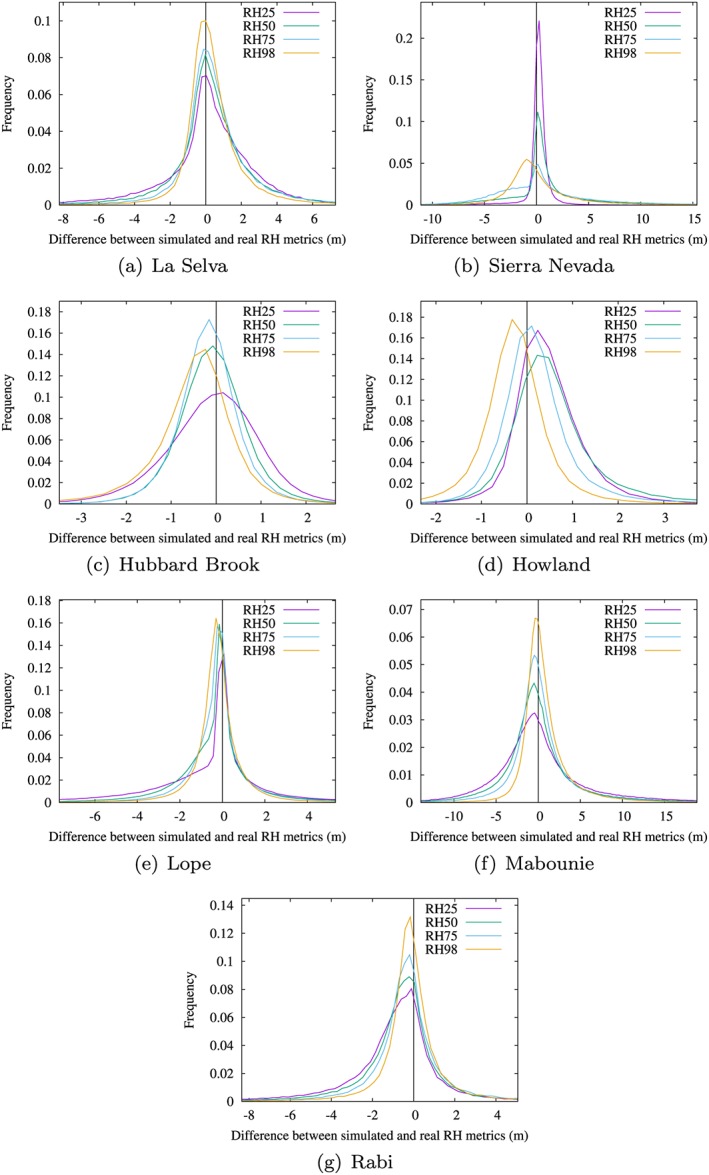
Figure 9.

Histograms of difference between observed and simulated Land, Vegetation, and Ice Sensor RH metrics for the count method with airborne laser scanning pulse density normalization. Examples are shown for La Selva (a), Sierra Nevada (b), Hubbard Brook (c), Howland (d), Lope (e), Mabounie (f), and Rabi (g) RH = relative height.
